
Seven analysis types on the platform
TerraScane has seven analysis types: Single, Topographic, Delta, Comparison, Batch, Land Cover, and Urban Heat Island. Each type answers a different question about the parcel and produces its own files. You can find the details of the datasets on the satellite data page and the index formulas on the indices page.
Single: one period, one index
Single analysis examines a parcel with one index over the period you choose. As the dataset, you choose Sentinel-2 (10 m), Landsat 8 and 9 (30 m), Landsat 7 (30 m, 1999 to 2024), Landsat 5 (30 m, 1984 to 2012), or MODIS (1,000 m). Sentinel-2 offers all 13 indices; Landsat offers every index except NDRE, plus surface temperature (LST) in °C; MODIS offers NDVI and EVI. You set the date range and the cloud threshold.
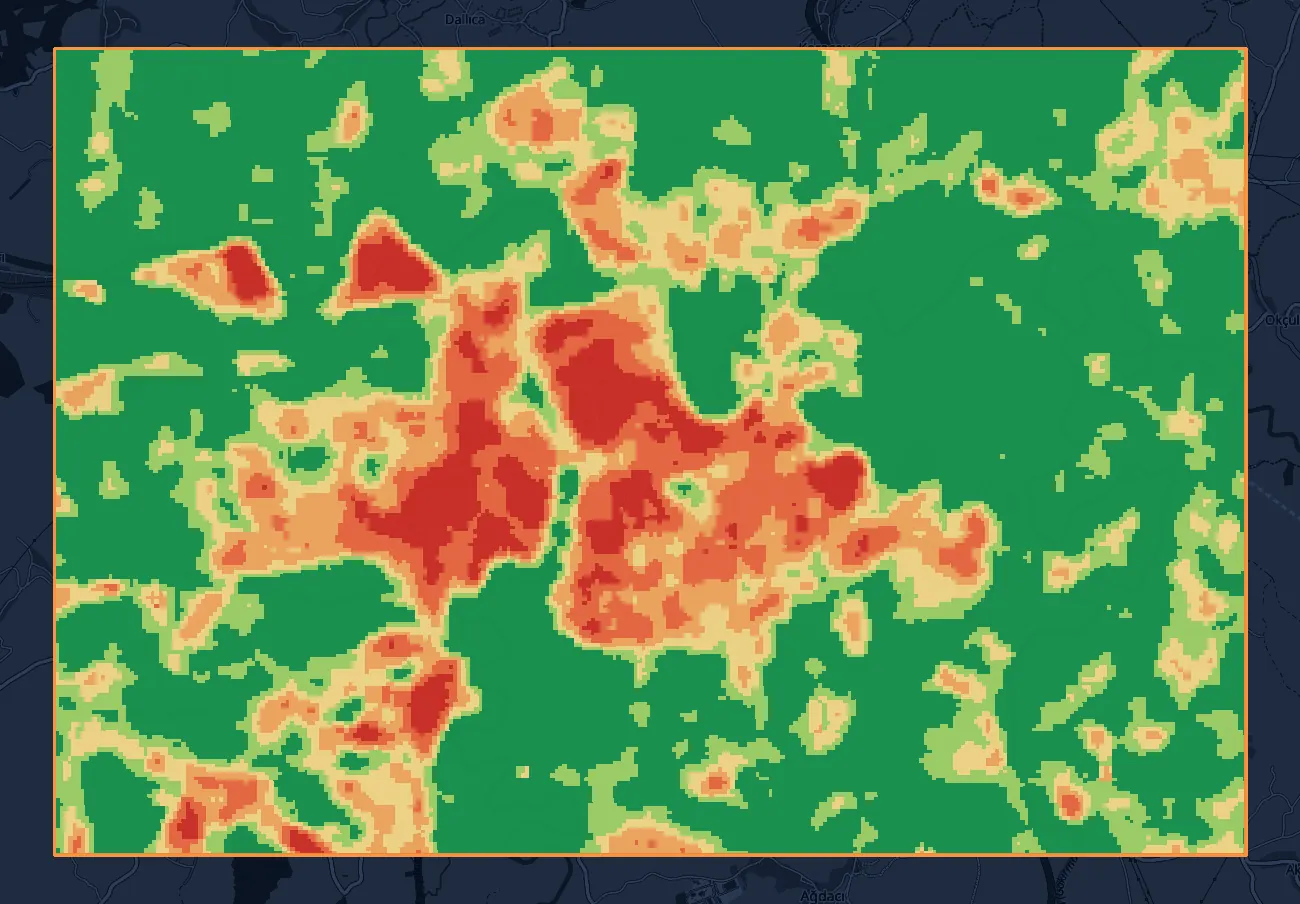
The pixels in the parcel are sorted into classes by index value, and the area of each class is given in hectares and as a percentage.
- Question it answers
- In the period I chose, which part of the parcel falls in which class, and how many hectares is each class?
- Outputs
- PDF, Excel, KMZ, and GeoTIFF; the PDF in Turkish or English. For spectral index results, "Download all (ZIP)" gets the PDF, Excel, and KMZ at once. Surface temperature also gives you PDF, Excel, KMZ, and GeoTIFF; the GeoTIFF carries the temperature values.
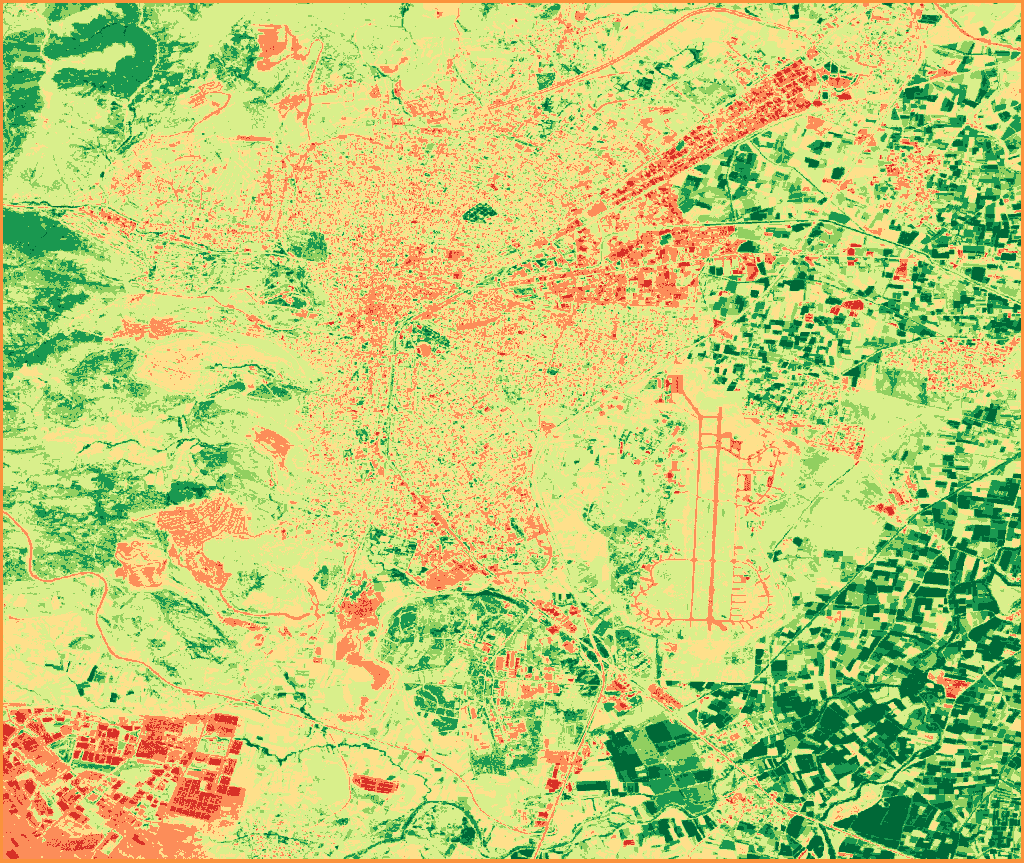
- Water Bodies-1 to 0
- Bare Soil0 to 0.1
- Sparse Vegetation0.1 to 0.2
- Low Density0.2 to 0.4
- Medium Density0.4 to 0.6
- Dense Vegetation0.6 to 0.8
- Very Dense Vegetation0.8 to 1
NDVI, single period · Sentinel-2 (10 m) · July 1-31, 2026 · Balıkesir-Merkez · 17 images
Contains modified Copernicus Sentinel data 2026
Topographic: slope and aspect
Slope and aspect are calculated from the Copernicus GLO-30 elevation model and need no date or cloud input. In the panel, you select them in Single mode.
- Question it answers
- How much of the parcel is steep, and which way do the slopes face?
- Outputs
- PDF, Excel, KMZ, and GeoTIFF. "Download all (ZIP)" gets the PDF, Excel, and KMZ at once.
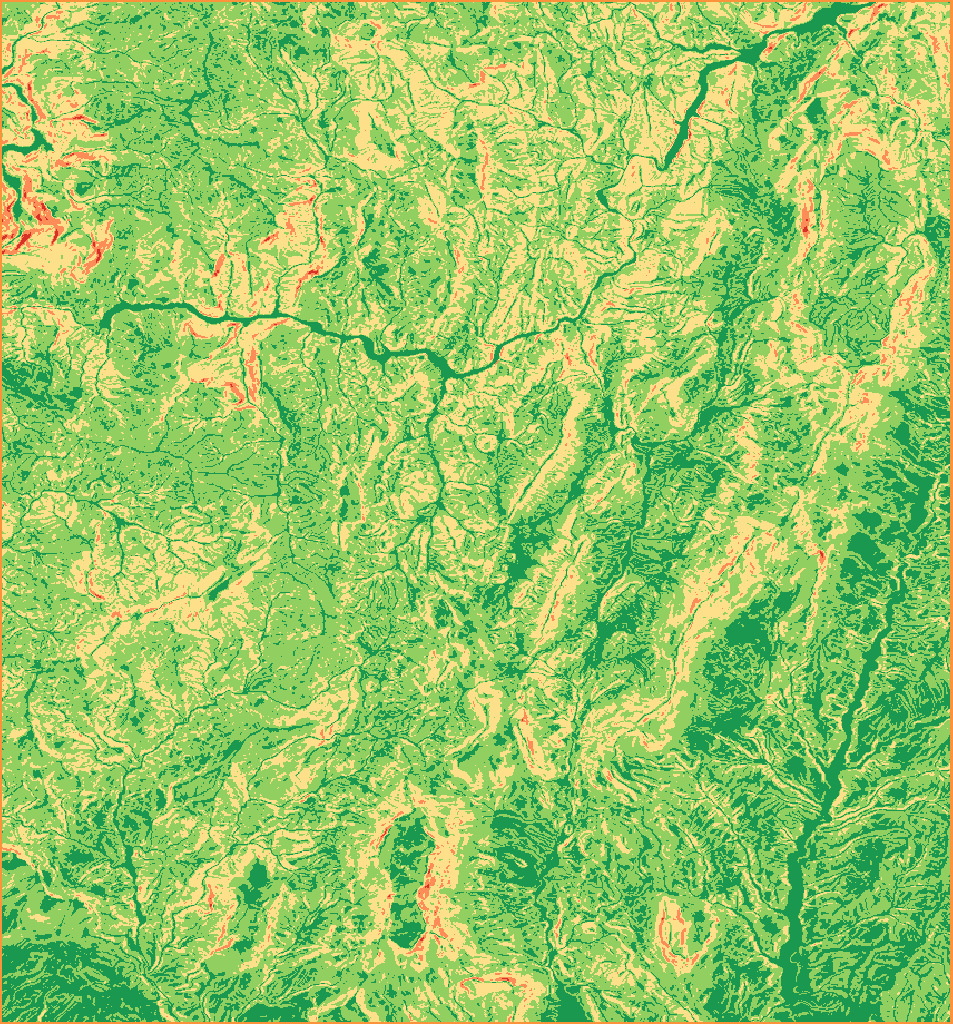
- Flat and Gentle Slope0 to 15°19.49%
- Moderate Slope15 to 30°54.99%
- Steep30 to 45°24.16%
- Very Steep45 to 60°1.29%
- Precipitous / Cliff60 to 90°0.06%
Slope · Copernicus GLO-30 DEM (30 m) · Dağılcak
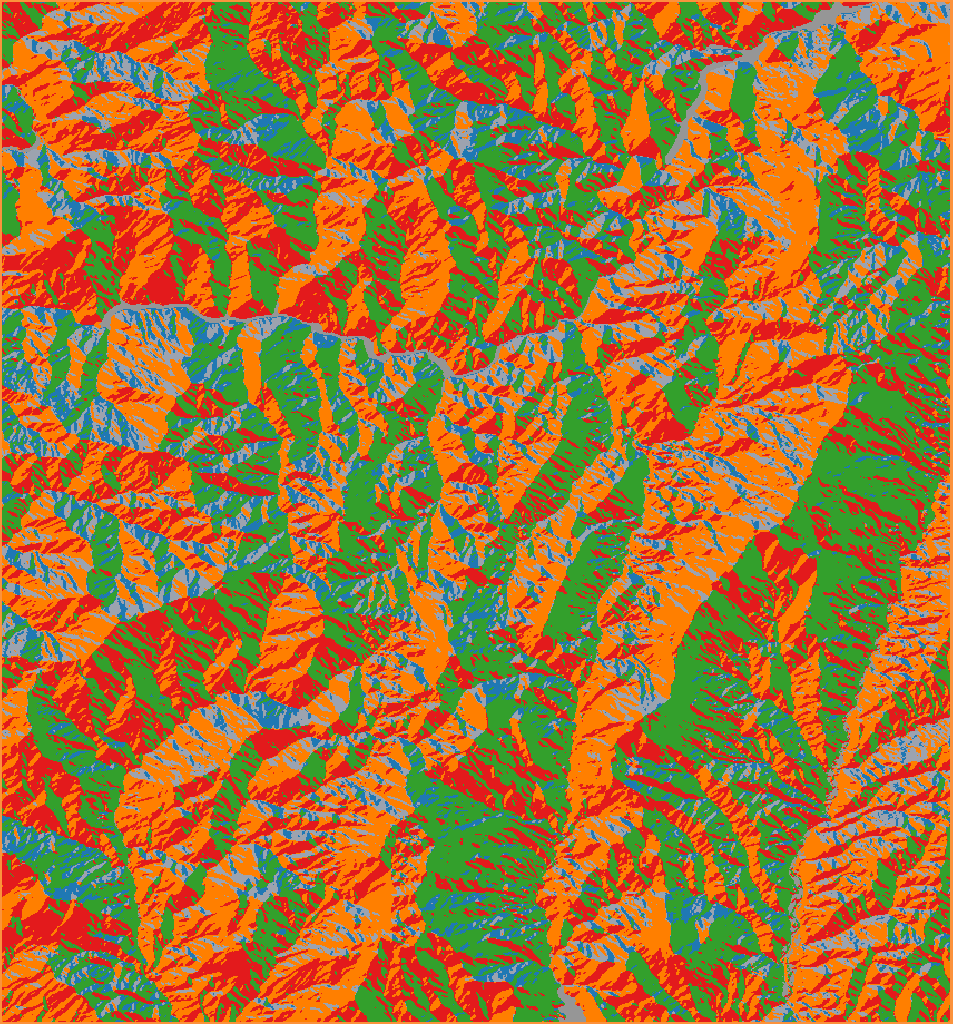
- Flatslope < 2°0.93%
- North315 to 45°18.04%
- East45 to 135°28.48%
- South135 to 225°24.07%
- West225 to 315°28.49%
Aspect · Copernicus GLO-30 DEM (30 m) · Dağılcak
produced using Copernicus WorldDEM-30 © DLR e.V. 2010-2014 and © Airbus Defence and Space GmbH 2014-2018 provided under COPERNICUS by the European Union and ESA; all rights reserved
The organisations in charge of the Copernicus programme by law or by delegation do not incur any liability for any use of the Copernicus WorldDEM-30
Delta: time series and change map
Delta gives two results in one analysis: a time series of the index by week, month, or year, and a change map of the difference between two periods. You set the dataset, the index (with Landsat, you can also choose LST), the series frequency, the two dates, and the cloud threshold. With "Period Comparison" turned on in the panel, you enter four dates for two separate periods. When NBR is selected, the difference follows the dNBR convention in the fire literature: the last period is subtracted from the first.
- Question it answers
- How did the index evolve over time, and where and by how much did it change between two periods?
- Outputs
- A change report (PDF), a change GeoTIFF, a KMZ, and two Excel files, one for the time series and one for the change. With LST selected, you get a PDF and a KMZ.
- As a service
- Change and loss detection
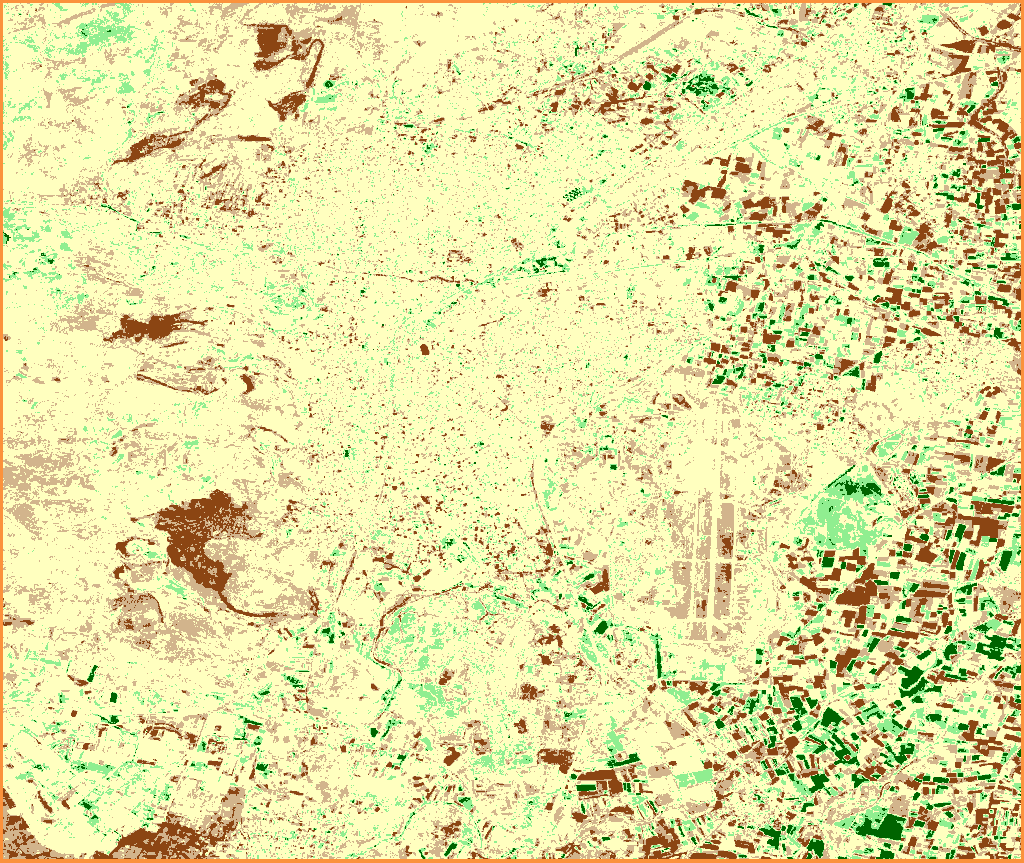
- Severe Degradation-2 to -0.256.8%
- Slight Decline-0.25 to -0.116.1%
- No Change-0.1 to 0.167.2%
- Slight Improvement0.1 to 0.257.8%
- Strong Improvement0.25 to 22%
NDVI change, June 2020 to June 2026 · Sentinel-2 (10 m) · Balıkesir-Merkez
Contains modified Copernicus Sentinel data 2020, 2026
Comparison: two dates side by side
Comparison puts two dates of the same parcel side by side, with the same dataset and index. On the map, the two periods are overlaid; drag the divider between them to move from one to the other. The dataset is the same in both periods; you choose the index (with Landsat, you can also choose LST), the dates of the two periods, and the cloud threshold. To see the difference as a single map, use Delta; Comparison shows the two periods on separate maps.
- Question it answers
- What did the parcel look like on the two dates, and how did the area of each class differ between the two periods?
- Outputs
- A five-page PDF (cover and method, first period, second period, side-by-side comparison, scientific commentary), an Excel file, a KMZ with both period layers and their timestamps, and a separate GeoTIFF for each period. With LST selected, you get a PDF, a KMZ, and an Excel file.
- As a service
- Change and loss detection
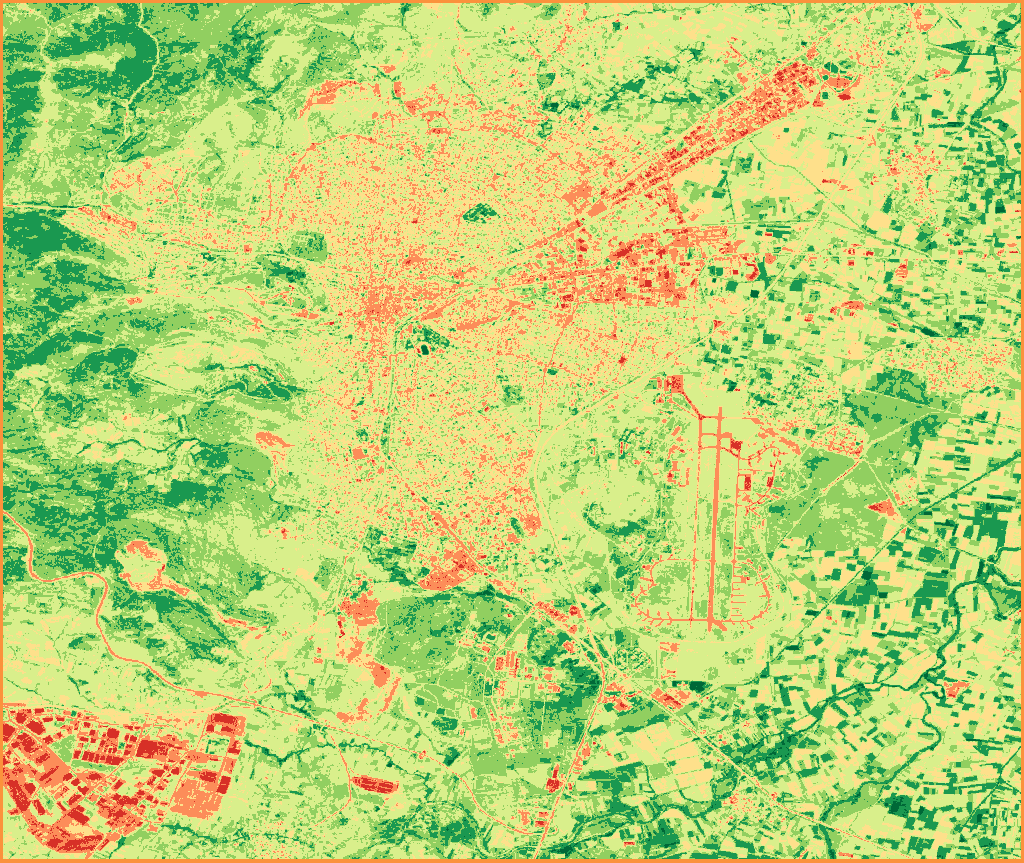
NDVI, period 1 · Sentinel-2 (10 m) · June 1-30, 2020 · Balıkesir-Merkez · 11 images
Contains modified Copernicus Sentinel data 2020
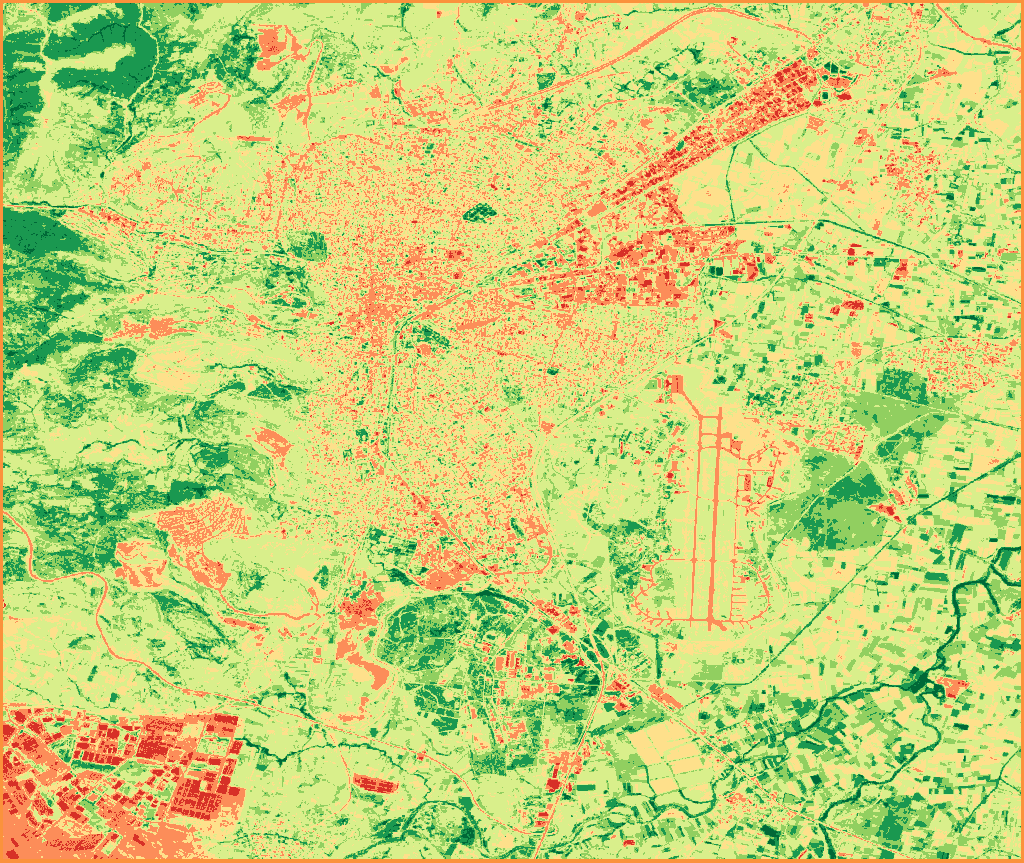
NDVI, period 2 · Sentinel-2 (10 m) · June 1-30, 2026 · Balıkesir-Merkez · 16 images
Contains modified Copernicus Sentinel data 2026
- Water Bodies-1 to 0
- Bare Soil0 to 0.1
- Sparse Vegetation0.1 to 0.2
- Low Density0.2 to 0.4
- Medium Density0.4 to 0.6
- Dense Vegetation0.6 to 0.8
- Very Dense Vegetation0.8 to 1
Batch: every parcel in the portfolio
Batch analysis covers every parcel in your portfolio at once, with the same dataset, index, and periods. The maximum number of parcels in one analysis depends on your organization. You set the dataset, the index (with Landsat, you can also choose LST), the period type, the periods, the cloud threshold, and the report language (Turkish, English, or both). With the "Include maps" option, each parcel report also includes the maps of the periods.
There are four period types: weekly (14 to 31 days), bi-weekly (2 to 4 periods), monthly (2 to 7 months), and yearly (2 to 7 years).
- Question it answers
- How did each parcel in the portfolio evolve over the periods I chose?
- Outputs
- A PDF and an Excel file for each parcel in every language you choose, a KMZ for each parcel, and an Excel file summarizing all parcels. The files come in a single ZIP, split into parcel folders.
- As a service
- Batch parcel analysis
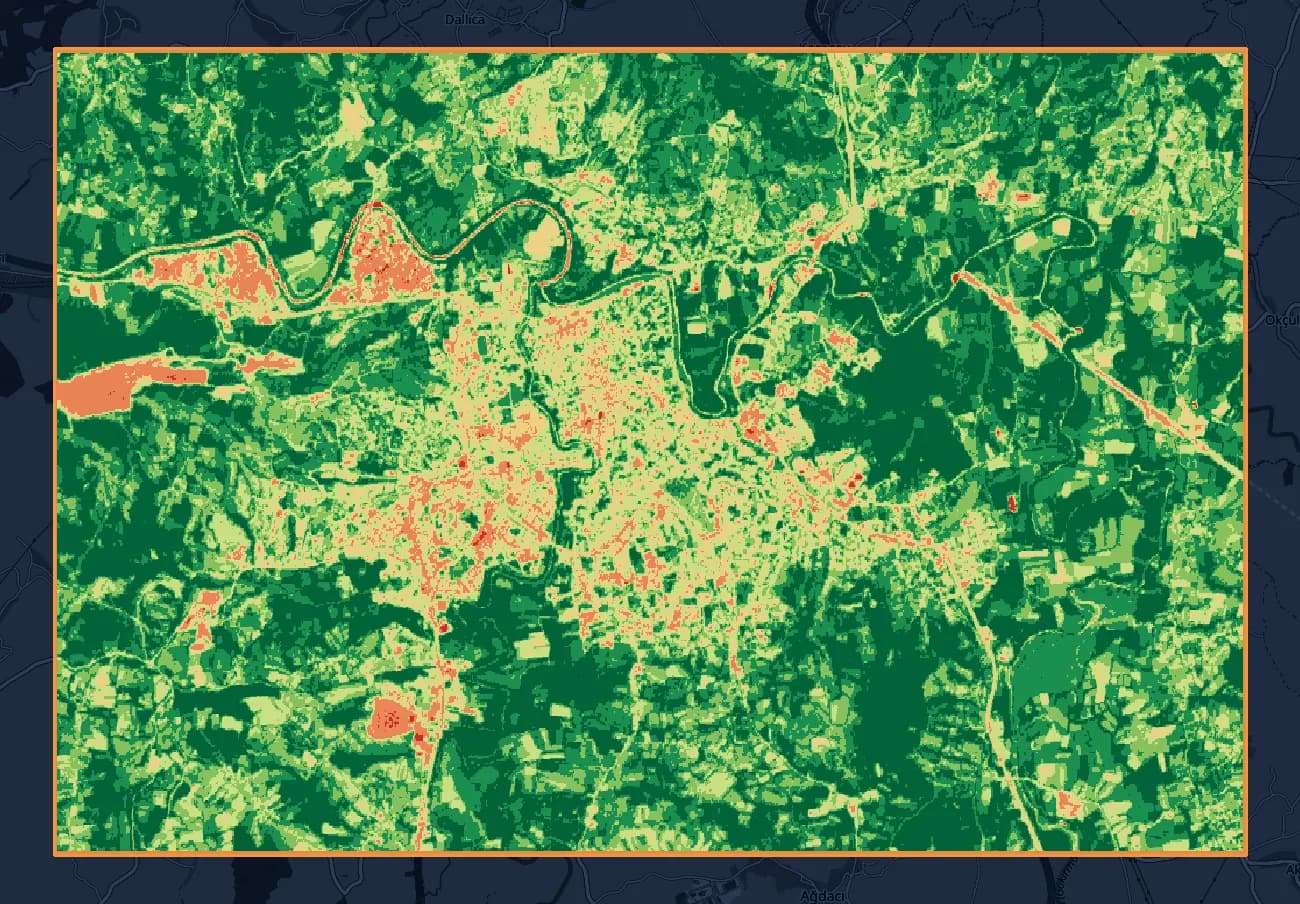
- Water Bodies-1 to 00.1%
- Bare Soil0 to 0.13.1%
- Sparse Vegetation0.1 to 0.27.5%
- Low Density0.2 to 0.413.0%
- Medium Density0.4 to 0.619.8%
- Dense Vegetation0.6 to 0.827.8%
- Very Dense Vegetation0.8 to 128.7%
NDVI, monthly period: June 2024 · Sentinel-2 (10 m) · Bartın (4,908 ha)
Contains modified Copernicus Sentinel data 2024 · © OpenStreetMap contributors
Land Cover: what covers each part of the parcel
Land Cover maps which part of the parcel falls in which cover class, for a single year or by comparing two years. Classes: water, trees, grass, flooded vegetation, crops, shrub & scrub, built area, bare ground, and snow & ice. Area is calculated at 10 m resolution. You can select any year from 2016 to the current year; for the current year, the images from January 1 to the date of the analysis are used.
The same mode has optional wetland screening, which is off by default. Each parcel gets a single result (high, medium, low, none, or not assessed) and its reasoning.
- Question it answers
- Which parts of the parcel are trees, cropland, water, or built area, and how did that mix change over the years? With screening on: does the parcel overlap a wetland?
- Output
- For each parcel, a KMZ file that opens in Google Earth; the yearly layers are inside the file.
- As a service
- Land cover and Wetland screening
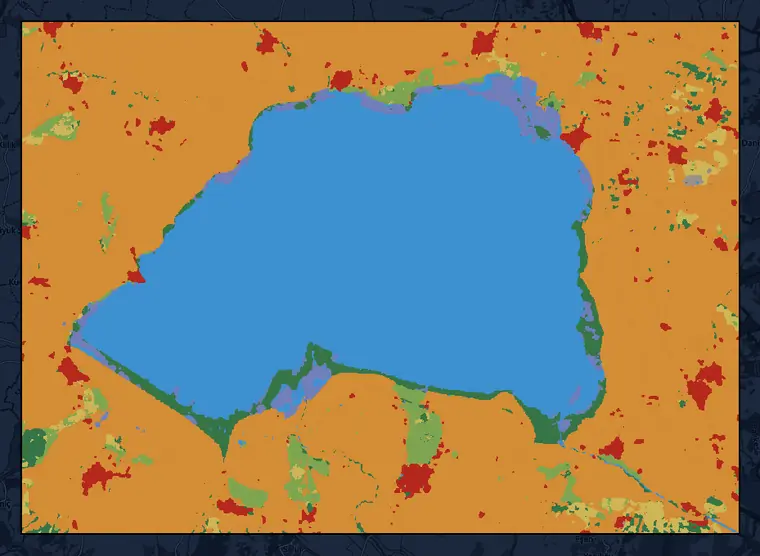
- Crops55.6%
- Water31.9%
- Trees3.4%
- Built area2.9%
- Grass2.5%
- Flooded vegetation2.0%
- Shrub & scrub1.7%
- Bare ground0.1%
- Snow & ice0.0%
Dynamic World land cover, 2026 (partial year) · 10 m · Lake Manyas area, Balıkesir (46,974 ha)
This dataset is produced for the Dynamic World Project by Google in partnership with National Geographic Society and the World Resources Institute. Contains modified Copernicus Sentinel data 2026 · CC BY 4.0 · © OpenStreetMap contributors
Urban Heat Island: surface temperature in cities
Urban Heat Island maps urban surface temperature in °C and uses the UTFVI indicator to classify the areas where the heat island effect concentrates. It works with Landsat 8 and 9 only; you choose the date range and the cloud threshold. Surface temperature is calculated in °C from the thermal band. UTFVI is derived from this temperature and shown in six classes. For small parcels (under about 10 hectares), a warning states that the result is indicative.
- Question it answers
- Which parts of the parcel are hotter, and where does the heat island effect concentrate?
- Outputs
- PDF, Excel, KMZ, and GeoTIFF; the PDF carries the UTFVI and temperature maps, and the GeoTIFF is the UTFVI map.
- Excellent (No heat stress)-1 to 0
- Good0 to 0.005
- Normal0.005 to 0.01
- Bad0.01 to 0.015
- Worse0.015 to 0.02
- Worst (Strongest UHI)0.02 to 1
UTFVI · Landsat 8 and 9 (thermal band, 100 m) · June 1 to September 30, 2026 · Bartın (4,908 ha) · 12 images
Landsat 8 and Landsat 9 data courtesy of the U.S. Geological Survey · © OpenStreetMap contributors
Two ways to work with us
Without signing up, you can run 5 analyses on 2 parcels of up to 7,500 hectares each. If you would like us to run the analysis, let's start with a pilot on a single parcel.
Other platform pages
Overview
TerraScane runs index analysis on Sentinel-2 and Landsat data for a parcel you draw or upload; you download the report in Turkish and English.
View
Outputs
PDF report, Excel spreadsheet, KMZ that opens in Google Earth, and GeoTIFF.
ViewSatellite data
Sentinel-2; Landsat 5, 7, 8, and 9; MODIS; and Copernicus DEM.
ViewIndices
All 13 spectral indices, NDVI included, with their formulas and bands.
View
Contains modified Copernicus Sentinel data 2020, 2026