
13 spectral indices and their formulas
The 13 spectral indices in TerraScane are formulas that turn two or more bands of a satellite image into a single value about vegetation, water, moisture, built-up land, burn scars, or soil. Each index section gives the formula, the Sentinel-2 and Landsat bands, the satellites it is calculated for, the literature reference, and when to choose it.
(NIR − RED) / (NIR + RED)- Sentinel-2
- B8 (842 nm), B4 (665 nm)
- Landsat 8 and 9
- SR_B5 (865 nm), SR_B4 (655 nm)
- Water Bodies-1 to 0
- Bare Soil0 to 0.1
- Sparse Vegetation0.1 to 0.2
- Low Density0.2 to 0.4
- Medium Density0.4 to 0.6
- Dense Vegetation0.6 to 0.8
- Very Dense Vegetation0.8 to 1
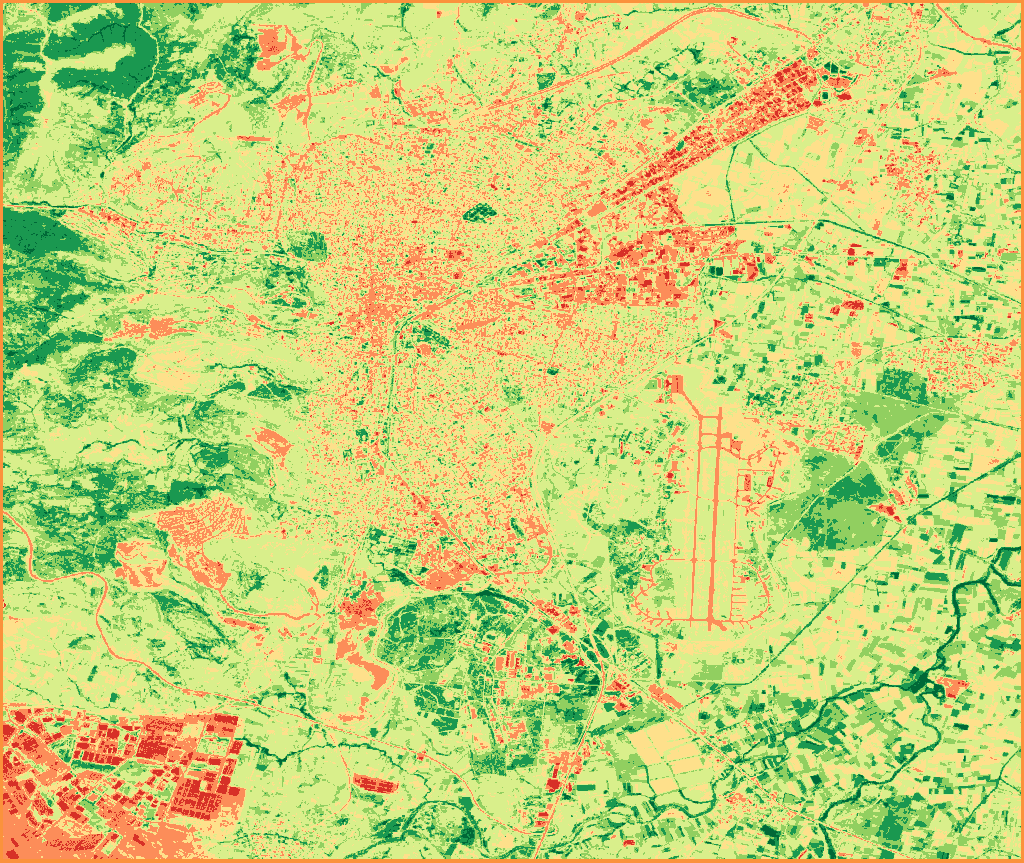
The classes and colors are the same as on the map of a Single NDVI analysis.
- Number of indices
- 13 spectral indices
- Formulas
- Same as the record in the PDF reports
- Bands
- With their Sentinel-2 and Landsat 8 and 9 names
- Reference
- A literature source for each index
- Sentinel-2 only
- NDRE, with the red edge band
- On MODIS
- NDVI and EVI
Each spectral index formula and band comes from the record that the platform writes into its PDF reports; the formula in the report of an NDVI analysis is the same as on this page.
Landsat bands are written with their Landsat 8 and 9 names. The TM and ETM+ sensors of Landsat 5 and 7 record the same spectral regions under different band numbers; the platform matches these bands itself, and the formula stays the same.
NDVI
Normalized Difference Vegetation Index
- How it is measured
(NIR − RED) / (NIR + RED)Sentinel-2 bands: B8 (842 nm), B4 (665 nm)
Landsat 8 and 9 bands: SR_B5 (865 nm), SR_B4 (655 nm)
- Satellites
Sentinel-2 · Landsat 5, 7, 8, and 9 · MODIS
- Reference
Rouse et al. (1974)
- When to use it
Use it to track how dense the green vegetation is and how it changes from period to period. Leaves absorb red light and reflect near-infrared; NDVI measures this difference. In very dense cover the value saturates: compare it with EVI there, and with SAVI where the cover is sparse and the soil shows through.
How is NDVI calculated?
To calculate NDVI, the difference between near-infrared (NIR) and red (RED) reflectance is divided by their sum: (NIR − RED) / (NIR + RED). On Sentinel-2, the bands are B8 (842 nm), B4 (665 nm); on Landsat 8 and 9, they are SR_B5 (865 nm), SR_B4 (655 nm). The result falls between −1 and +1, and the value rises as the green cover gets denser.
EVI
Enhanced Vegetation Index
- How it is measured
2.5 × (NIR − RED) / (NIR + 6×RED − 7.5×BLUE + 1)Sentinel-2 bands: B8 (842 nm), B4 (665 nm), B2 (490 nm)
Landsat 8 and 9 bands: SR_B5 (865 nm), SR_B4 (655 nm), SR_B2 (482 nm)
- Satellites
Sentinel-2 · Landsat 5, 7, 8, and 9 · MODIS
- Reference
Huete et al. (2002)
- When to use it
Use it in dense vegetation such as forest, where NDVI saturates, to see the differences. The blue band in the formula reduces the effect of atmospheric aerosols, and the constant term at the end reduces the effect of the soil beneath. In sparse cover this correction can skew the result; compare it with SAVI there, and with NDVI for long time series.
SAVI
Soil-Adjusted Vegetation Index
- How it is measured
((NIR − RED) / (NIR + RED + 0.5)) × 1.5Sentinel-2 bands: B8 (842 nm), B4 (665 nm)
Landsat 8 and 9 bands: SR_B5 (865 nm), SR_B4 (655 nm)
- Satellites
Sentinel-2 · Landsat 5, 7, 8, and 9
- Reference
Huete (1988)
- When to use it
Use it on fields and dry land where plants are sparse and the soil shows through, especially early in the growing season. The soil adjustment term in the formula offsets the brightness of the soil beneath. The term is set for medium-density cover, and in very dense cover the value saturates; compare it with EVI there, and with NDVI for continuous monitoring.
NDWI
Normalized Difference Water Index
- How it is measured
(GREEN − NIR) / (GREEN + NIR)Sentinel-2 bands: B3 (560 nm), B8 (842 nm)
Landsat 8 and 9 bands: SR_B3 (562 nm), SR_B5 (865 nm)
- Satellites
Sentinel-2 · Landsat 5, 7, 8, and 9
- Reference
McFeeters (1996)
- When to use it
Use it to find open water surfaces such as lakes, flood areas, and irrigated rice paddies, and to track water spreading and receding. Water absorbs almost all near-infrared and reflects green light; for the moisture held in plants, look at NDMI. Roofs and concrete can also give values similar to water, so in built-up areas compare the result with MNDWI.
NDMI
Normalized Difference Moisture Index
- How it is measured
(NIR − SWIR1) / (NIR + SWIR1)Sentinel-2 bands: B8 (842 nm), B11 (1610 nm)
Landsat 8 and 9 bands: SR_B5 (865 nm), SR_B6 (1609 nm)
- Satellites
Sentinel-2 · Landsat 5, 7, 8, and 9
- Reference
Wilson & Sader (2002)
- When to use it
Use it to track vegetation moisture and drought stress; logging and degradation in forests also lower the value. Water in leaves absorbs shortwave infrared, so the value rises with moisture. The shortwave infrared bands of Sentinel-2 and Landsat differ slightly, so compare periods from the same satellite; to separate greenness from moisture, look at NDVI.
NDBI
Normalized Difference Built-up Index
- How it is measured
(SWIR1 − NIR) / (SWIR1 + NIR)Sentinel-2 bands: B11 (1610 nm), B8 (842 nm)
Landsat 8 and 9 bands: SR_B6 (1609 nm), SR_B5 (865 nm)
- Satellites
Sentinel-2 · Landsat 5, 7, 8, and 9
- Reference
Zha et al. (2003)
- When to use it
Use it to track the spread of built-up land; a rising value shows that impervious surfaces such as concrete and asphalt are increasing. Built-up surfaces reflect more shortwave infrared, while plants reflect more near-infrared. In dry climates, bare and dry soil also gives high values; to tell them apart, compare the result with NDVI and BSI.
NBR
Normalized Burn Ratio
- How it is measured
(NIR − SWIR2) / (NIR + SWIR2)Sentinel-2 bands: B8 (842 nm), B12 (2190 nm)
Landsat 8 and 9 bands: SR_B5 (865 nm), SR_B7 (2201 nm)
- Satellites
Sentinel-2 · Landsat 5, 7, 8, and 9
- Reference
López García & Caselles (1991); Key & Benson (2006)
- When to use it
Use it to track burned area and how vegetation recovers after a fire; the platform calculates the difference between two periods with the dNBR convention: the last period is subtracted from the first. Living vegetation reflects near-infrared, while burned surfaces and ash are bright in the SWIR2 band, so a fire lowers the value. A low-severity fire can look like bare soil; to tell them apart, compare with NDVI.
GNDVI
Green Normalized Difference Vegetation Index
- How it is measured
(NIR − GREEN) / (NIR + GREEN)Sentinel-2 bands: B8 (842 nm), B3 (560 nm)
Landsat 8 and 9 bands: SR_B5 (865 nm), SR_B3 (562 nm)
- Satellites
Sentinel-2 · Landsat 5, 7, 8, and 9
- Reference
Gitelson, Kaufman & Merzlyak (1996)
- When to use it
Use it to track leaf chlorophyll and, indirectly, the nitrogen status of plants; unlike NDRE, it can also be calculated on Landsat. The green band still responds to chlorophyll changes in medium- and high-density cover, where the red band saturates. In very dense cover it can saturate too; compare it with NDRE on Sentinel-2 data, and with NDMI to separate out the effect of water stress.
MNDWI
Modified Normalized Difference Water Index
- How it is measured
(GREEN − SWIR1) / (GREEN + SWIR1)Sentinel-2 bands: B3 (560 nm), B11 (1610 nm)
Landsat 8 and 9 bands: SR_B3 (562 nm), SR_B6 (1609 nm)
- Satellites
Sentinel-2 · Landsat 5, 7, 8, and 9
- Reference
Xu (2006)
- When to use it
Use it instead of NDWI in built-up areas where you need to separate open water from buildings. Because it uses the SWIR1 band instead of near-infrared, it separates roofs and concrete from water. Snow and ice can also give values similar to water; compare the result with NDWI.
BSI
Bare Soil Index
- How it is measured
((SWIR1 + RED) − (NIR + BLUE)) / ((SWIR1 + RED) + (NIR + BLUE))Sentinel-2 bands: B11 (1610 nm), B4 (665 nm), B8 (842 nm), B2 (490 nm)
Landsat 8 and 9 bands: SR_B6, SR_B4, SR_B5, SR_B2
- Satellites
Sentinel-2 · Landsat 5, 7, 8, and 9
- Reference
Rikimaru et al. (2002); Chen et al. (2004)
- When to use it
Use it to track bare surfaces such as fallow fields or slopes exposed to erosion; a rising value shows that vegetation cover is decreasing. Soil reflects more in the shortwave infrared and red, and plants more in the near-infrared; BSI measures this contrast across four bands, including the blue band. Wet soil lowers the value, and soil color also affects the result; to confirm that the ground is really becoming bare, compare with NDVI or SAVI.
NDRE
Normalized Difference Red Edge Index
- How it is measured
(NIR − RedEdge) / (NIR + RedEdge)Sentinel-2 bands: B8 (842 nm), B5 (705 nm)
- Satellites
Sentinel-2
- Reference
Barnes et al. (2000)
- When to use it
Use it in agriculture to spot chlorophyll and nitrogen deficiency early; NDRE can show it before NDVI changes. The red edge band stays sensitive to chlorophyll in dense cover, where red saturates. Of the satellites on the platform, only Sentinel-2 has this band, at 20 m resolution; compare the result with GNDVI, and with NDMI to separate out the effect of water stress.
MNDBI
Modified Normalized Difference Built-up Index
- How it is measured
(SWIR2 − NIR) / (SWIR2 + NIR)Sentinel-2 bands: B12 (2190 nm), B8 (842 nm)
Landsat 8 and 9 bands: SR_B7 (2201 nm), SR_B5 (865 nm)
- Satellites
Sentinel-2 · Landsat 5, 7, 8, and 9
- Reference
SWIR2 variant of NDBI; original study: Zha et al. (2003)
- When to use it
Use it to test the NDBI result with a second shortwave infrared band; the value rises as built-up surface increases. It uses SWIR2 instead of the SWIR1 band in NDBI, and places where the two indices diverge point to differences in moisture or minerals. Its thresholds depend on the site, so read the value as a change between periods, and compare it with NDVI and BSI to separate built-up land from bare soil.
NDTI
Normalized Difference Tillage Index
- How it is measured
(SWIR1 − SWIR2) / (SWIR1 + SWIR2)Sentinel-2 bands: B11 (1610 nm), B12 (2190 nm)
Landsat 8 and 9 bands: SR_B6 (1609 nm), SR_B7 (2201 nm)
- Satellites
Sentinel-2 · Landsat 5, 7, 8, and 9
- Reference
Van Deventer et al. (1997)
- When to use it
Use it to track whether stubble and crop residue stay on the field after harvest, and so how intensive the tillage is; a high value shows a surface covered with residue. Cellulose and lignin in the residue absorb light in the SWIR2 band, and the index measures this by comparing SWIR2 with SWIR1. Wet soil and wet stubble skew the result; choose an image from a dry period, and compare with NDVI to separate green plants from dead residue.
Two ways to work with us
Without signing up, you can run 5 analyses on 2 parcels of up to 7,500 hectares each. If you would like us to run the analysis, let's start with a pilot on a single parcel.
Other platform pages
Overview
TerraScane runs index analysis on Sentinel-2 and Landsat data for a parcel you draw or upload; you download the report in Turkish and English.
View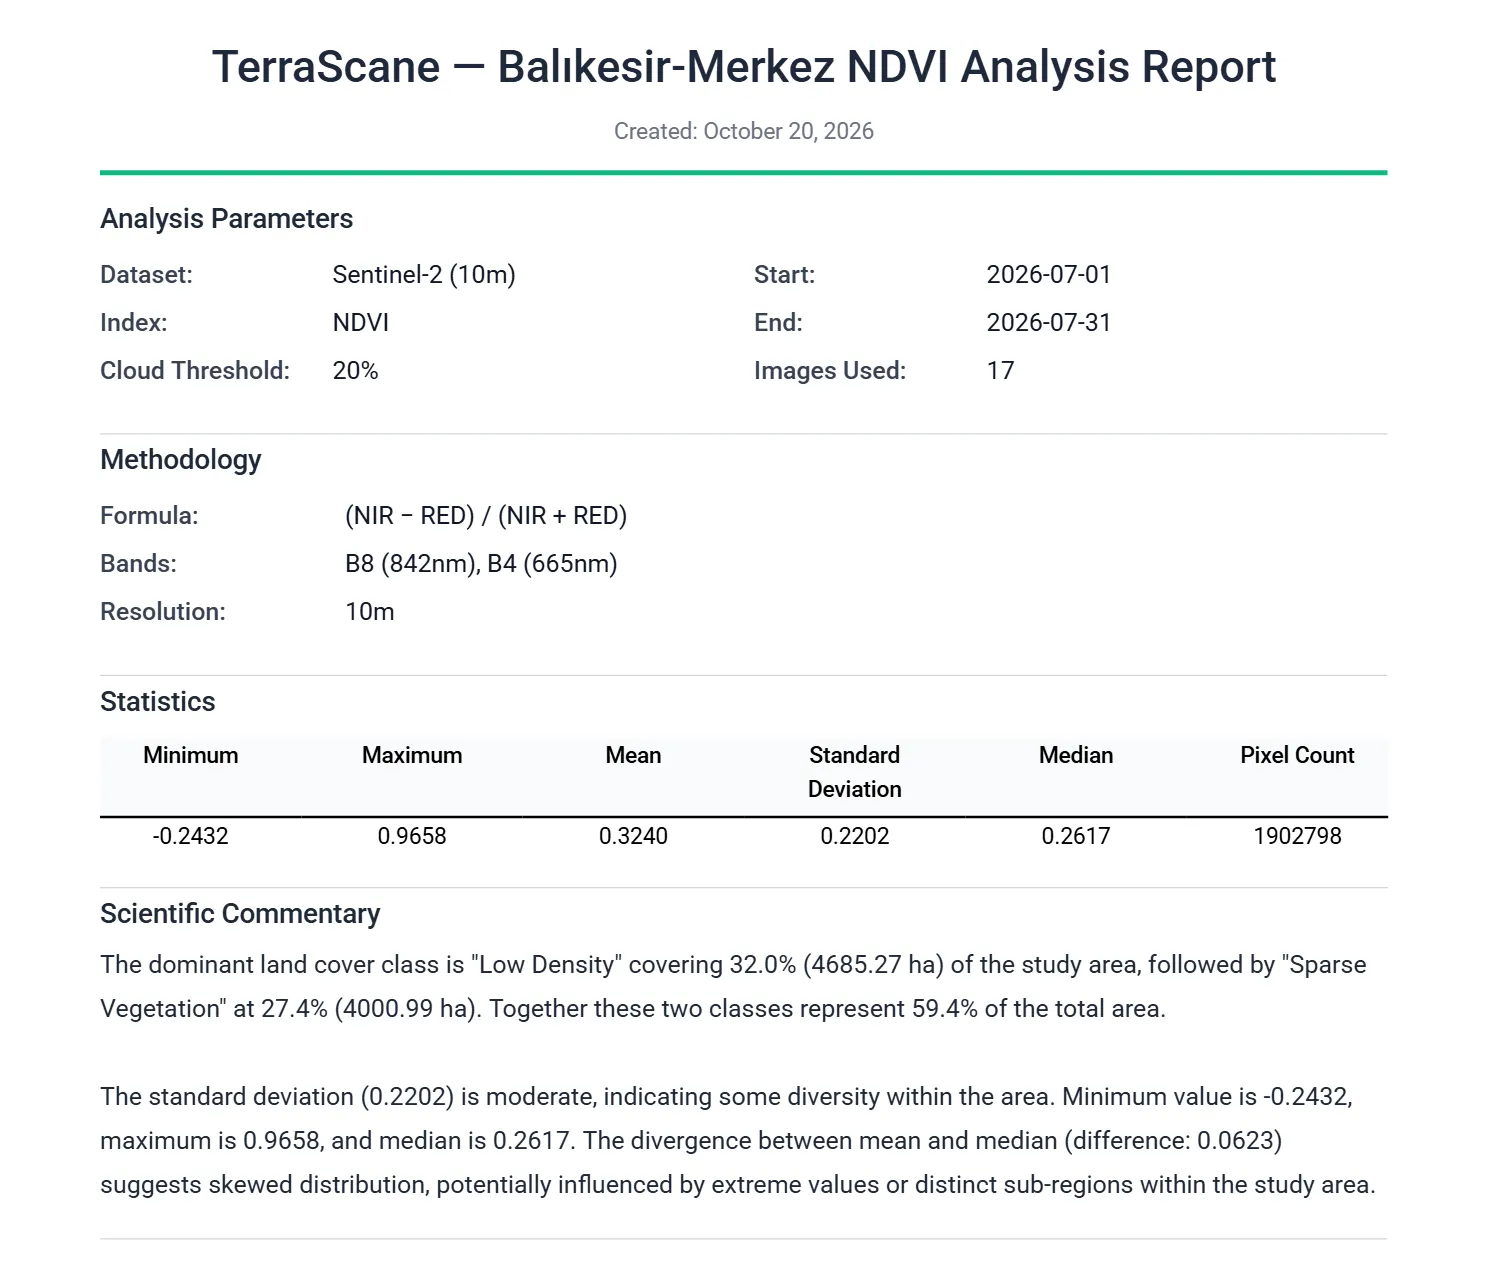
Outputs
PDF report, Excel spreadsheet, KMZ that opens in Google Earth, and GeoTIFF.
View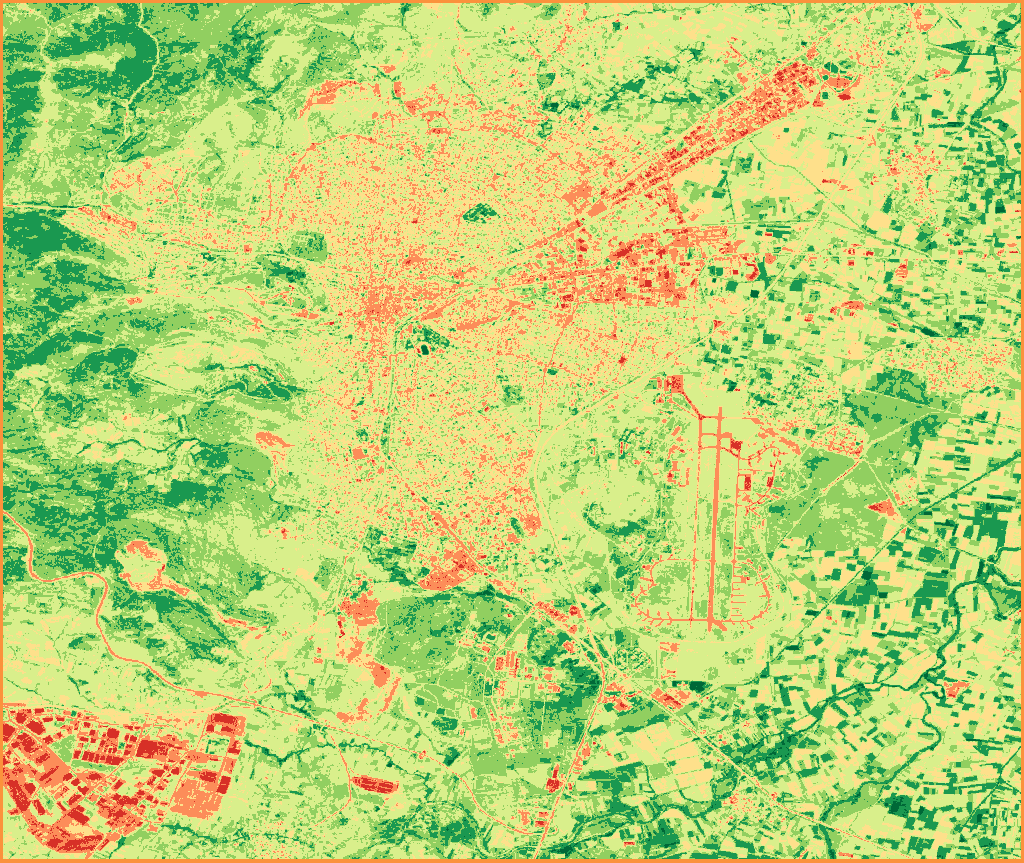
Satellite data
Sentinel-2; Landsat 5, 7, 8, and 9; MODIS; and Copernicus DEM.
View
Analysis types
Single, Topographic, Delta, Comparison, Batch, Land Cover, and Urban Heat Island analyses.
View
Contains modified Copernicus Sentinel data 2020, 2026