Skip to content

Change and loss detection

Change and loss detection uses satellite imagery to map what changed on a parcel between two dates and reports the changed area in hectares. For fire and vegetation loss, we show the week or month when the event appears and how many hectares it affected. For jobs with a cut-off date, such as December 31, 2020, under the EUDR, we prepare a change table that compares the situation before that date with today.

Send your parcel
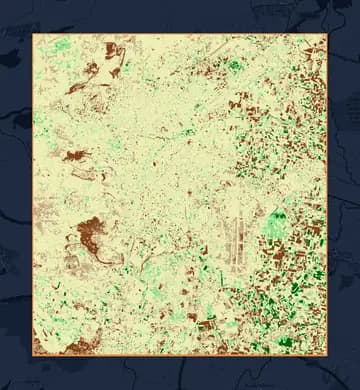
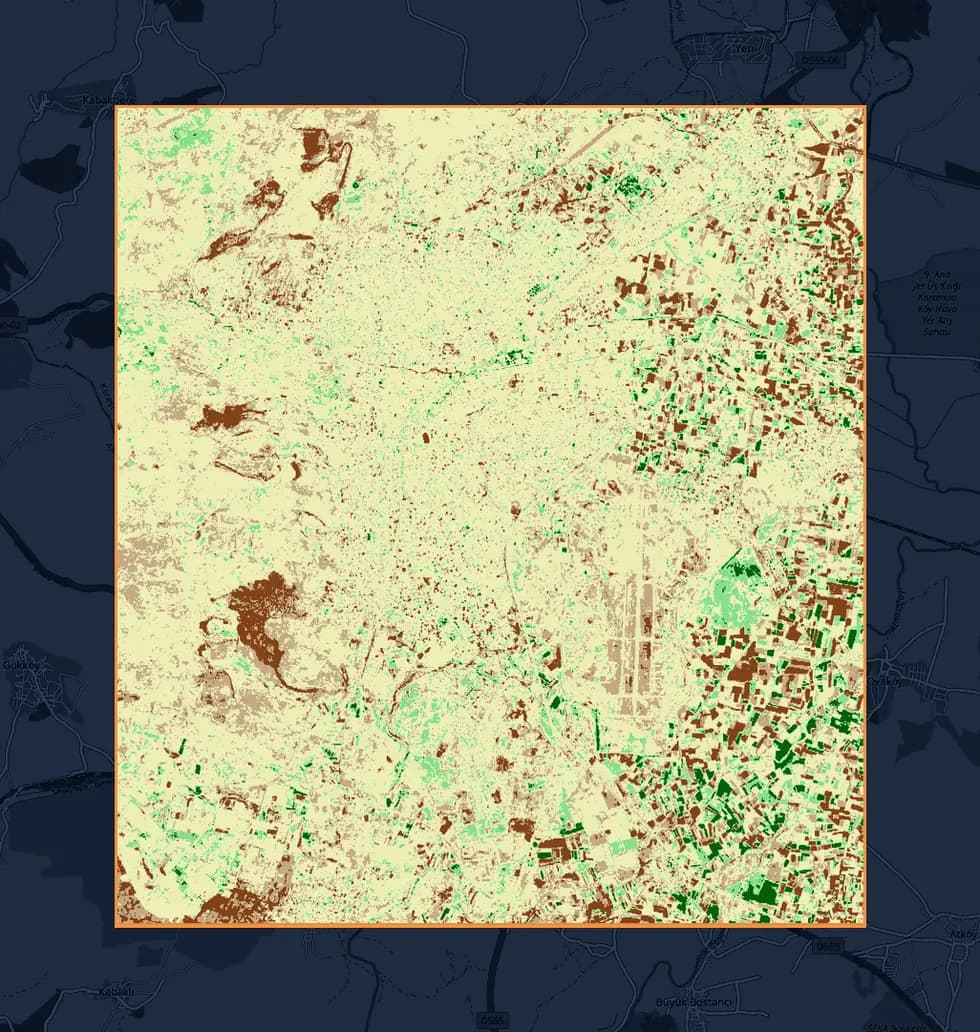
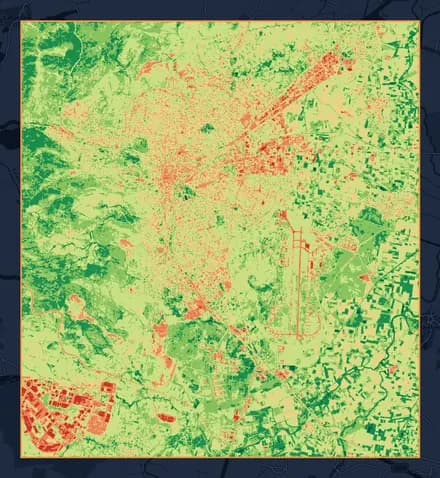
NDVI change map of Balıkesir-Merkez between June 2020 and June 2026, on an OpenStreetMap base map: degraded areas in brown, improved areas in green.

NDVI change

  • Severe Degradation6.8%
  • Slight Decline16.1%
  • No Change67.2%
  • Slight Improvement7.8%
  • Strong Improvement2.0%

NDVI change, June 2020 to June 2026 · Sentinel-2 (10 m) · Balıkesir-Merkez

Contains modified Copernicus Sentinel data 2020, 2026 · © OpenStreetMap contributors

Who it is for
Exporters who need cut-off date evidence, insurance teams assessing damage, and consultants tracking carbon projects year by year
What we deliver
A PDF change report, two Excel spreadsheets, and a KMZ file
Index
NDVI difference for vegetation loss, dNBR (burn index difference) for fire
Satellite
Sentinel-2 (10 m); Landsat (30 m) before 2017, back to 1984
Report language
Turkish, English, or both
Input
Parcel boundary file (KML, KMZ, SHP, or GeoJSON) or corner coordinates

What you get

Time series

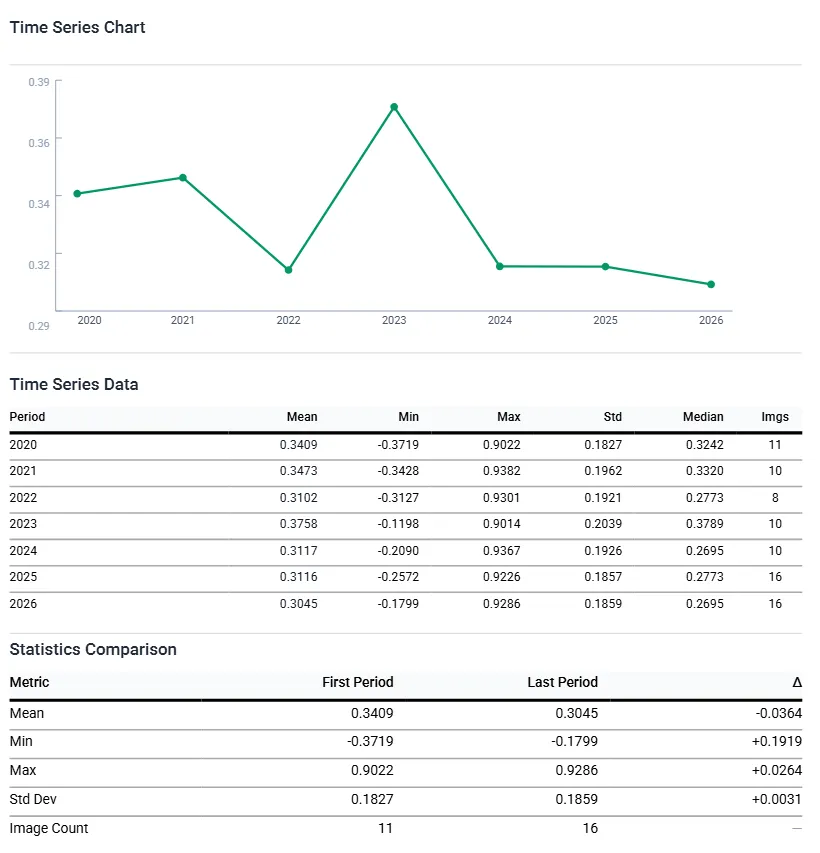
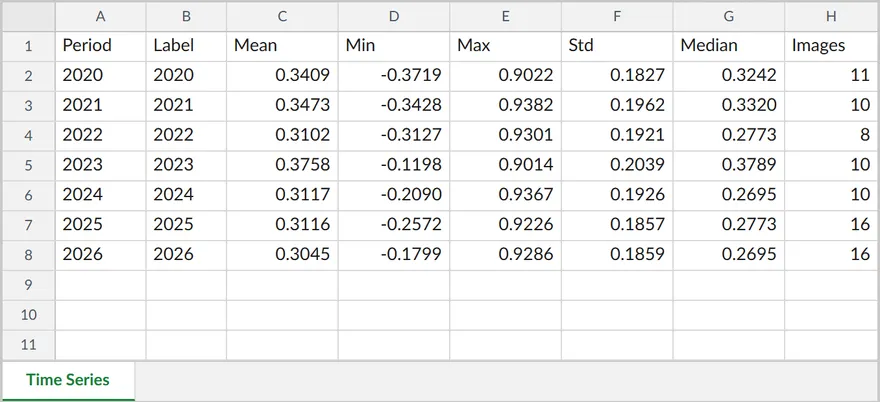
In the same analysis, we also prepare a time series that shows the index week by week, month by month, or year by year. From this series, you can read when the event began. For permanence monitoring, we use the yearly series, which shows the parcel's state year by year.

Show table
Yearly mean NDVI
YearMean NDVIImages
20200.340911
20210.347310
20220.31028
20230.375810
20240.311710
20250.311616
20260.304516

Mean NDVI, yearly series · Balıkesir-Merkez · Sentinel-2 (10 m)

Contains modified Copernicus Sentinel data 2020-2026
Change map

The change map shows the index difference between two periods. The difference is split into classes of decline and increase, and the area of each class goes into the table in hectares and as a percentage. For vegetation loss, we look at the NDVI difference, and for fire, at the difference in the NBR index between the two periods (dNBR); in a fire, the affected area is broken down in hectares by burn severity.

Area share of NDVI change classes, June 2020 to June 2026
ClassArea (ha)Percent (%)
Severe Degradation992.066.8
Slight Decline2,356.8416.1
No Change9,823.7767.2
Slight Improvement1,147.187.8
Strong Improvement297.782.0

June 2020 to June 2026 · Balıkesir-Merkez

Cut-off date

For jobs with a cut-off date, we place the first period before the cut-off date and the second after it. The change table gives the difference between the two periods class by class, in hectares.

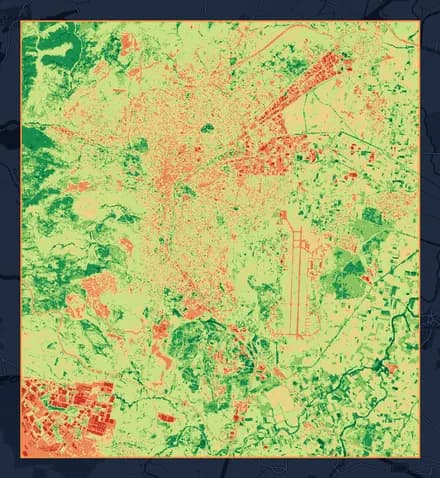
NDVI map of Balıkesir-Merkez, June 2020.
Period 1June 1-30, 2020
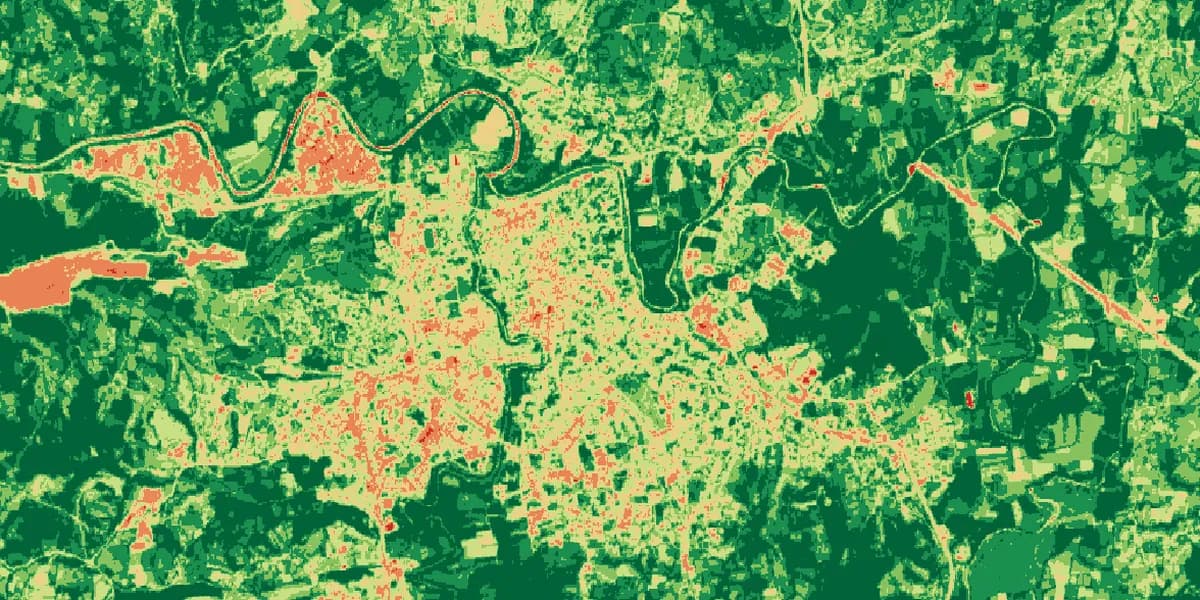
NDVI map of Balıkesir-Merkez, June 2026.
Period 2June 1-30, 2026
Cut-off dateDecember 31, 2020

Contains modified Copernicus Sentinel data 2020, 2026 · © OpenStreetMap contributors

Deliverables

The delivery includes a PDF change report, two Excel spreadsheets (time series and change), and a KMZ file that opens in Google Earth. Reports are prepared in Turkish, English, or both. If you want to see the two dates side by side, we also prepare a five-page comparison report, with each period's map on its own page and a scientific commentary on the last page.

Excerpt from the change report's time series page: the chart and the table of yearly values.
Time series Excel spreadsheet: year, mean, minimum, maximum, standard deviation, median, and image count.
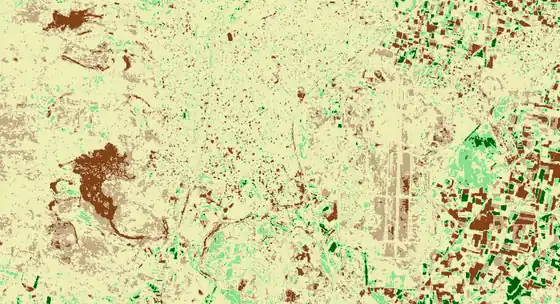
KMZ layer: NDVI change map of Balıkesir-Merkez with its boundary, on an OpenStreetMap base map.

Contains modified Copernicus Sentinel data 2020, 2026 · © OpenStreetMap contributors

How we work

  1. 1

    We take your parcel boundary file.

  2. 2

    We set the period and scope together with you: the two periods to compare, the index, the time series frequency (weekly, monthly, or yearly), the satellite, and the report language. If there is a cut-off date, one of the periods falls before it.

  3. 3

    We prepare the change map and the time series in the same analysis.

  4. 4

    We deliver the report, the spreadsheets, and the KMZ file.

Turnaround time

With a system we built ourselves, we cut file and report preparation from months to weeks, even days.

What it documents

The report states the date ranges of the two compared periods and the number of images used in each.

The distribution of change goes into the table in hectares. The difference between a parcel's state before December 31, 2020, and its state today is thus recorded in the same document, with dates and areas.

The time series gives the index value for each week, month, or year.

The event's date narrows down to one step of the series: one week in a weekly series, one month in a monthly series. A week or month without a cloud-free image stays empty in the series; in that case, the date range also covers the empty step.

Each report carries the data, method, threshold, and literature reference it was produced with.

The metadata lists the dataset, the cloud threshold, the index formula and bands, and the literature reference. Reports produced with Landsat 5 or 7 imagery also carry the data quality note for those satellites.

Inputs

What we need from you

  • Parcel boundary file: KML, KMZ, SHP, or GeoJSON. Without a file, a list of parcel corner coordinates is enough; we draw the boundaries.
  • Two dates or two date ranges to compare. If you know the date of an event such as a fire, include it; we set up the periods that cover the time before and after it.
  • Your cut-off date, if any; we set up the periods accordingly.
  • Report language: Turkish, English, or both.

For comparisons that reach back before 2017, we use Landsat imagery; the Landsat archive goes back to 1984. Landsat imagery has a resolution of 30 meters and Sentinel-2 imagery 10 meters.

What we prepare

  • Sentinel-2 or Landsat imagery for both periods
  • An index map for each period
  • A change map and the area of each class
  • A weekly, monthly, or yearly time series
  • A PDF report, two Excel spreadsheets, and a KMZ file

Pilot

Let's start with a single parcel, set up for your goal; once you have seen the result, move on to the whole portfolio.

Send your parcel

Other services

Land cover: Esri, Impact Observatory, Microsoft · This dataset is produced for the Dynamic World Project by Google in partnership with National Geographic Society and the World Resources Institute. Contains modified Copernicus Sentinel data 2024, 2026 · CC BY 4.0 · clipped to the parcel · © OpenStreetMap contributors