
Indicator
You get one wetland indicator for each parcel: high, medium, low, none, or not assessed. Its reasoning is written below the indicator.
Field verification is recommended
HighManyas example
Medium
Low
None
Not assessed
Wetland screening uses the satellite archive to check, before the project starts, whether each parcel overlaps with a wetland. We deliver one result per parcel, with its reasoning, in a KMZ file that opens in Google Earth. When you set risky parcels aside at the first stage, your project file moves on to the next stages without them.
Send your parcel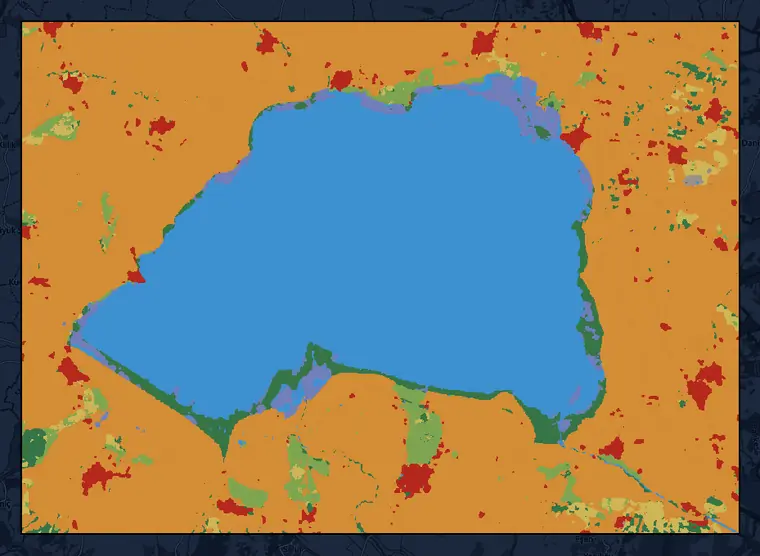 2026 · partial year
Wetland Indicator
Wetland screening and Dynamic World land cover, 2026 (partial year) · 10 m · Lake Manyas area, Balıkesir (46,974 ha)
This dataset is produced for the Dynamic World Project by Google in partnership with National Geographic Society and the World Resources Institute. Contains modified Copernicus Sentinel data 2016, 2026 · CC BY 4.0 · © OpenStreetMap contributors
You get one wetland indicator for each parcel: high, medium, low, none, or not assessed. Its reasoning is written below the indicator.
Field verification is recommended
The reasoning shows which satellite observations support the result and which period they come from. The distance from the parcel to the nearest open water is also given in kilometers.
Wetland Screening
Wetland Indicator: High
Field verification is recommended.
Open-water indicators
Vegetated-wetland indicators
201 net observations
Nearest open water: 0 km · Coordinates: 40.1845°, 27.9720°
When the indicator comes out high or medium, the file recommends field verification. A parcel without enough observations is marked "not assessed" and kept separate from the "none" result; for these parcels, you decide by reading the reasoning.
We run the screening in the same job as the land cover analysis; each parcel's KMZ file holds the land cover map next to the wetland result. The file is prepared in Turkish, English, or both.
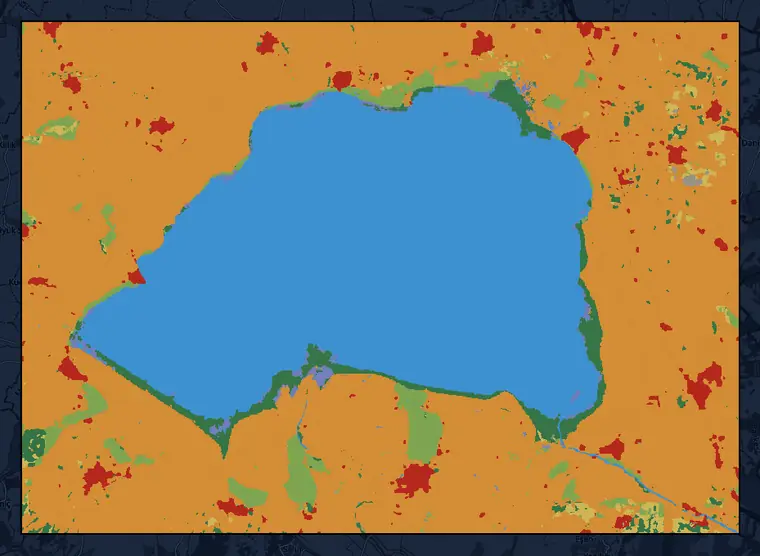
| 2016 | 2026 (partial year) | |
|---|---|---|
| Crops | 57.2% | 55.6% |
| Water | 32.2% | 31.9% |
| Trees | 3.2% | 3.4% |
| Built area | 2.5% | 2.9% |
| Grass | 3.3% | 2.5% |
| 2016 | 2026 (partial year) | |
|---|---|---|
| Flooded vegetation | 0.7% | 2.0% |
| Shrub & scrub | 0.9% | 1.7% |
| Bare ground | 0.1% | 0.1% |
| Snow & ice | 0.0% | 0.0% |
Dynamic World land cover, 10 m · Lake Manyas area, Balıkesir (46,974 ha) · percentages for 2016 and 2026
This dataset is produced for the Dynamic World Project by Google in partnership with National Geographic Society and the World Resources Institute. Contains modified Copernicus Sentinel data 2016, 2026 · CC BY 4.0 · © OpenStreetMap contributors
We take your parcel boundary file.
We set the scope together with you: which parcels to screen, which year or years the land cover map covers, and the file language.
We screen every parcel with the same settings; each observation period used appears in the file with its dates.
We deliver each parcel's KMZ file.
Turnaround time
With a system we built ourselves, we cut file and report preparation from months to weeks, even days.
Shows with satellite observations whether the parcel bears signs of a wetland.
The indicator is based on observations of open water and vegetated wetland; the balloon states which observation contributed to the result and which period it comes from. This is a screening result: when the indicator is high or medium, the file recommends field verification.
Records the parcel's distance to the nearest open water in kilometers.
Even when the parcel has no overlap with a wetland, you see in the same file how close it is to the water's edge.
Records which period of satellite data the screening is based on.
The file states the years the indicator is based on and how many net observations were used; data for the current year runs up to the day the file was created. The indicator, the reasoning, and the land cover map sit in the same file, which you can add to your project records.
Let's first screen a single parcel, set up for your goal; once you have seen the result, move on to the whole portfolio.
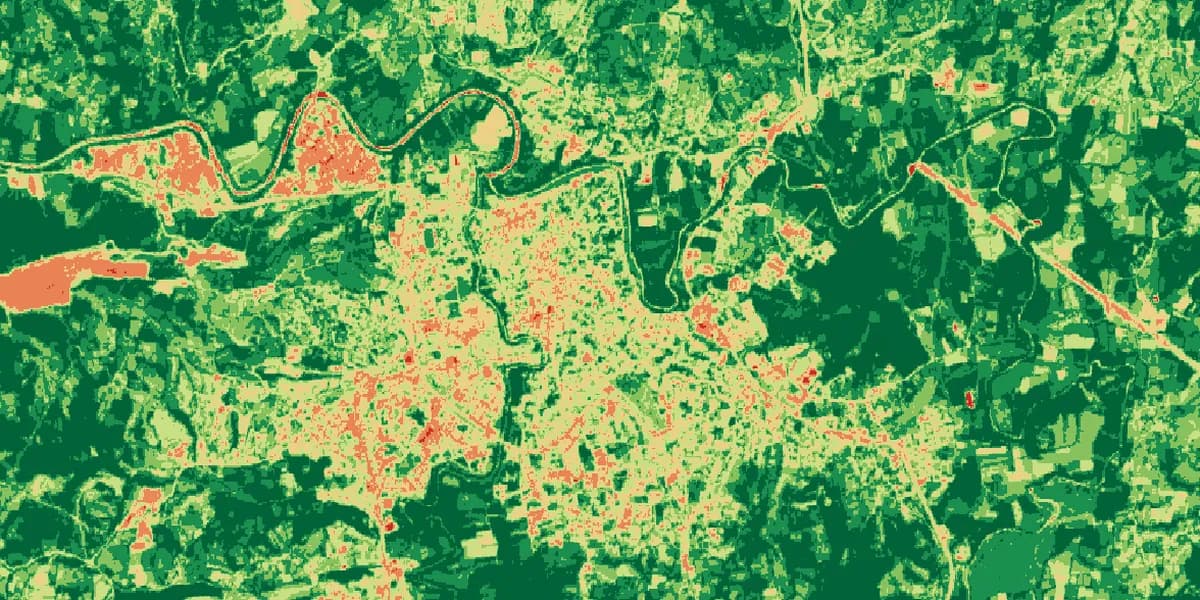
We analyze every parcel in your portfolio for your chosen periods with the same settings.
View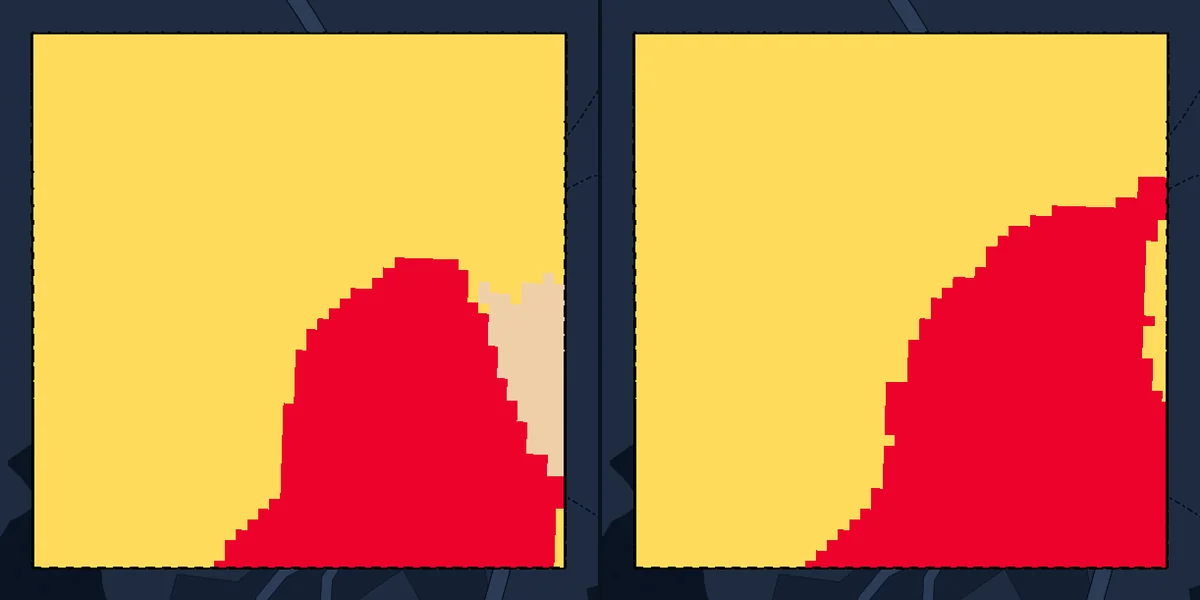
We deliver a Google Earth file showing which parts of the parcel are trees, crops, water, or built area, and how that changed over the years.
View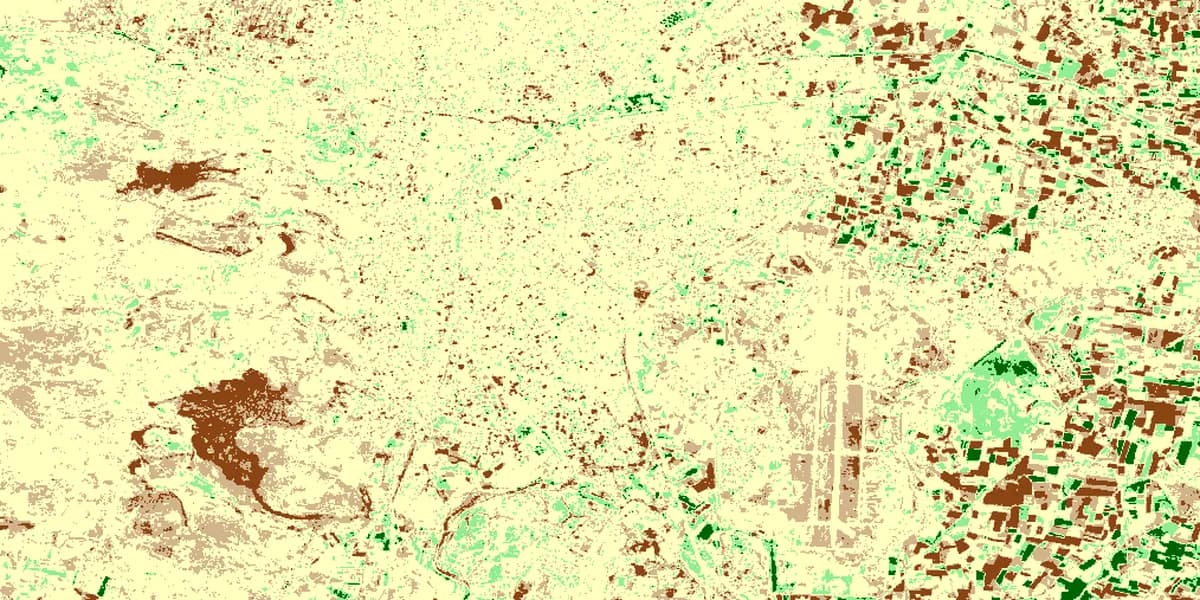
We map where and how much changed between two dates; for fire and cover loss, we provide the event period and a change table relative to the cut-off date.
ViewLand cover: Esri, Impact Observatory, Microsoft · Contains modified Copernicus Sentinel data 2020, 2024, 2026 · CC BY 4.0 · clipped to the parcel · © OpenStreetMap contributors
