Skip to content

Land cover

Land cover analysis uses satellite imagery to map which parts of your parcel are trees, crops, water, or built area. If you choose two years, the same file also shows the change between them. For each parcel, we prepare a KMZ file that opens in Google Earth. You can forward the file to your field team as is; the team sees the parcel boundary and the cover map on the same screen.

Send your parcel
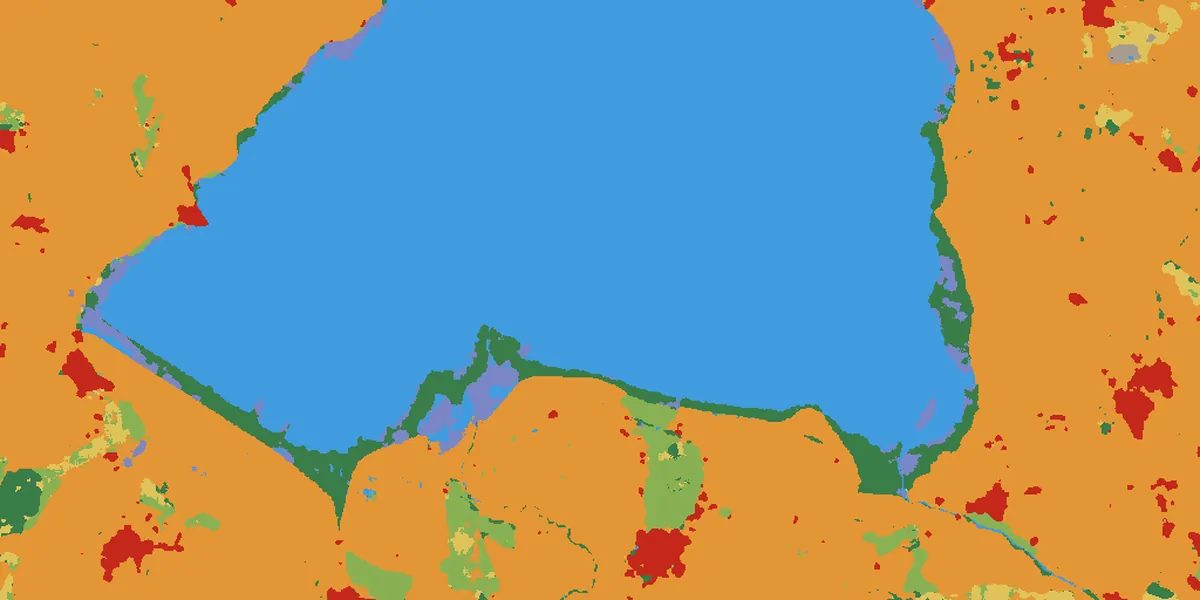
2025 land cover map of a 25 ha test parcel in Akdağmadeni, on an OpenStreetMap base map: crops in yellow, built area in red.2025
2017 land cover map of the same parcel.2017

Land cover

Land cover shares, 2017 and 2025
20172025
Crops71.4%67.9%
Built Area24.7%32.1%
Rangeland3.8%0.0%

Esri land cover, 2025; inset map 2017 · 10 m · Akdağmadeni, Yozgat (25 ha test parcel)

Land cover: Esri, Impact Observatory, Microsoft · CC BY 4.0 · clipped to the parcel · © OpenStreetMap contributors

Who it is for
Growers, exporters, and consultants who want to document how their parcels' land has been used over the years
What we deliver
A separate KMZ file for each parcel
Years
2016 to this year; a single year or a comparison of two years
File language
Turkish, English, or both
Input
Parcel boundary file (KML, KMZ, SHP, or GeoJSON) or corner coordinates

What you get

Layers

When you open the file in Google Earth, you see the parcel's land cover map for each year you chose as a separate layer. The parcel boundary and the map legend are in the file too.
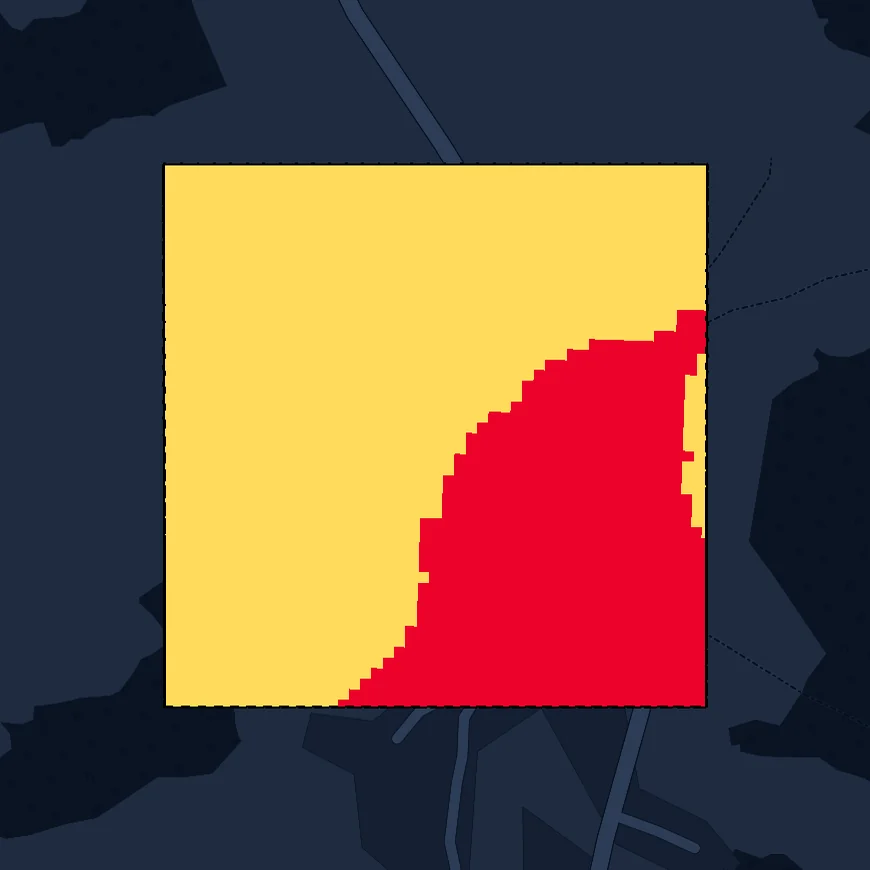
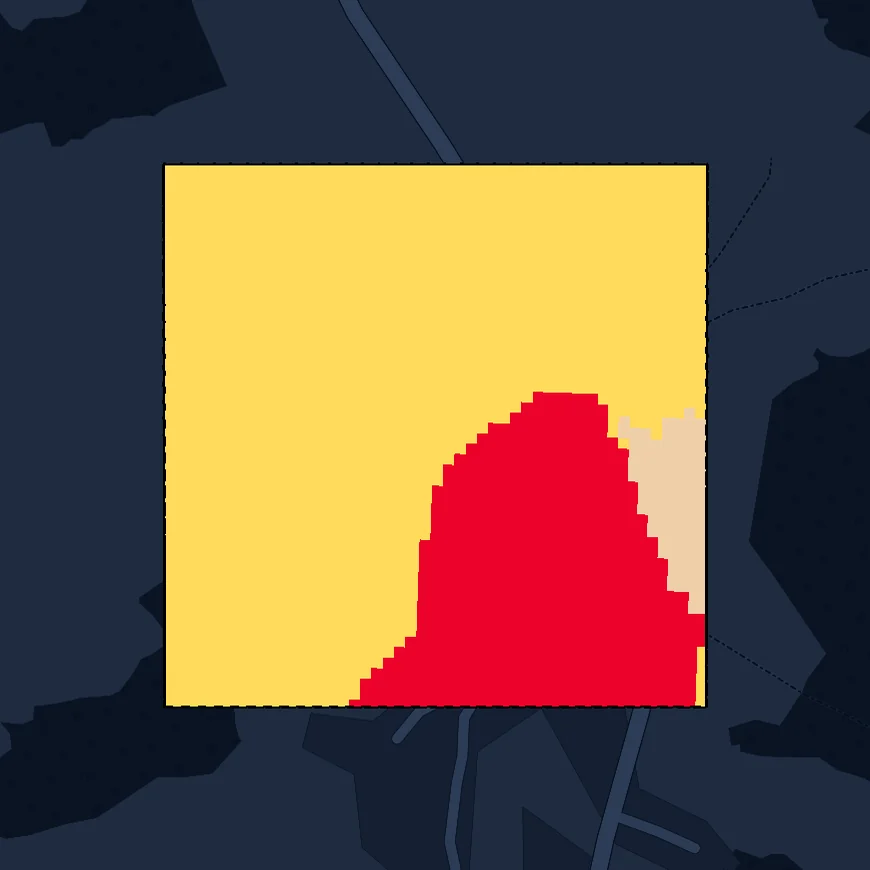
KMZ layer: 2025 land cover map of the test parcel.KMZ layer: 2017 land cover map of the test parcel.
  • Crops
  • Built Area
  • Rangeland

Esri land cover, 10 m · Akdağmadeni, Yozgat · 25 ha test parcel

Land cover: Esri, Impact Observatory, Microsoft · CC BY 4.0 · clipped to the parcel · © OpenStreetMap contributors
Info balloon

The parcel's info balloon lists the dominant cover type for each year, the area of each cover type in hectares and as a percentage, and the parcel's coordinates.

Akdağmadeni test parcel

Land Cover

2017 · dominant: Crops

2017 land cover areas
Crops17.86 ha71.4%
Built Area6.19 ha24.7%
Rangeland0.95 ha3.8%

2025 · dominant: Crops

2025 land cover areas
Crops16.96 ha67.9%
Built Area8.03 ha32.1%

Coordinates: 39.7500°, 36.0000°

Year selection

You can look at a single year or compare two years; any year from 2016 to this year can be selected. If you choose the current year, the map is produced from imagery taken between January 1 and the day the job is run, and is marked as a partial year in the file.

Two selected years: 2017 and 2025This year: partial year

Cover types and language

Besides trees, crops, water, and built area, the map shows other cover types, such as rangeland and bare ground, in separate colors. The file is prepared in Turkish, English, or both; if you choose both, you get two separate files for each parcel.

  • TreesAğaçlık
  • CropsTarım
  • WaterSu
  • Built AreaYapılı Alan
  • RangelandÇayır / Çalı
  • Bare GroundÇıplak Toprak

If you like, we can add wetland screening to the same job; the screening result appears in the parcel's info balloon.

How we work

  1. 1

    We take your parcel boundary file.

  2. 2

    We set the scope together with you: a single year or a comparison of two years, which years, whether to add wetland screening, and the file language.

  3. 3

    We process every parcel in one run, with the same settings.

  4. 4

    We deliver each parcel's KMZ file.

Turnaround time

With a system we built ourselves, we cut file and report preparation from months to weeks, even days.

What it documents

Shows, with a map and hectares, what covers the parcel in each selected year.

When two years are compared, the difference can be read from the same file. For example, if a section that was cropland in 2018 is built area in 2025, you see this in the layers and area tables for both years.

The info balloon also states the map's source and resolution.

Anyone reading the file sees from the file itself what the map is based on. A year without a cloud-free image is marked "no data" in the file; a partial year is set apart by the mark next to its year label.

You can add this file to your compliance documentation as a dated record of the parcel's cover in given years, with areas.

With the same file, your field team also finds the section it will check on the map.

Inputs

What we need from you

  • Parcel boundary file: KML, KMZ, SHP, or GeoJSON. Without a file, a list of parcel corner coordinates is enough; we draw the boundaries.
  • The year you want to look at, or two years to compare, from 2016 to this year.
  • Your cut-off date, if any. We place one comparison year before it and the other after it.
  • File language: Turkish, English, or both.

What we prepare

  • Land cover maps for the years you choose
  • The area of each cover type, in hectares and as a percentage
  • Each year's dominant cover type, in the info balloon
  • A separate KMZ file for each parcel, with the parcel boundary and legend

Pilot

Let's start with a single parcel, set up for your goal; once you have reviewed the file in Google Earth, move on to the whole portfolio.

Send your parcel