
What is NDVI and how to use it on a field
Author: Cumhur Eren BilalPublished: Last updated:
NDVI, the Normalized Difference Vegetation Index, is a ratio calculated from the red and near-infrared bands of a satellite image to show how dense the vegetation is. It ranges from -1 to +1: it is high over dense green cover and 0.1 or lower over bare rock, sand, and snow.
The numbers in this guide come from a real analysis of Balıkesir-Merkez run on TerraScane, a satellite analysis platform, and each one is given with its date, dataset, and area. The formula, the value ranges, and the satellite data come first.
| Topic | In brief |
|---|---|
| Formula | NDVI = (NIR - RED) / (NIR + RED) |
| Value range | -1 to +1 |
| Sentinel-2 bands | B8 for NIR, B4 for red (both 10 m) |
| Landsat 8 and 9 bands | Band 5 for NIR, band 4 for red (30 m) |
| Indicative ranges (USGS) | 0.1 or lower is bare surface, 0.2 to 0.5 is sparse cover, 0.6 to 0.9 is dense cover |
| Example analysis | Balıkesir-Merkez, 14,623 ha, July 1-31, 2026, Sentinel-2: mean NDVI 0.3240 |
What does NDVI measure?
Healthy vegetation absorbs most of the visible light that reaches it and reflects a large share of near-infrared light. Sparse or stressed vegetation reflects more visible light and less near-infrared (NASA Earth Observatory). NDVI turns that contrast into a single number.
The index goes back to a 1974 paper by Rouse and colleagues, which examined how a ratio of two bands of the ERTS-1 satellite related to green biomass on rangelands (NASA NTRS). NDVI reflects how dense the green cover is; its relationship to fractional vegetation cover and leaf area index is discussed by Carlson and Ripley (1997) (DOI).
How is NDVI calculated?
The NDVI formula divides the difference between near-infrared (NIR) and red (RED) reflectance by their sum:
NDVI = (NIR - RED) / (NIR + RED)
On Sentinel-2 the NIR band is B8 and the red band is B4; both have a 10 m resolution (SentiWiki). On Landsat 8 and 9, NIR is band 5 (0.85 to 0.88 µm) and red is band 4 (0.64 to 0.67 µm). On Landsat 5 and 7 the same bands are band 4 and band 3 (USGS). TerraScane analysis reports state the formula and the bands used; the formulas and bands of all 13 spectral indices are listed on the indices page.
What do NDVI values mean?
USGS describes NDVI as varying between -1.0 and +1.0 and gives approximate value ranges (USGS):
| NDVI range | What it usually corresponds to |
|---|---|
| 0.1 or lower | Bare rock, sand, or snow |
| 0.2 to 0.5 | Sparse cover: shrubs, grassland, senescing crops |
| 0.6 to 0.9 | Dense cover: temperate and tropical forests, crops at peak growth |
Sources cut the ranges in different places: NASA Earth Observatory puts shrub and grassland at 0.2 to 0.3 and rainforests at 0.6 to 0.8. The class limits are indicative. The same crop falls in the 0.2 to 0.5 range as it senesces and in the 0.6 to 0.9 range at its peak, so values for the same parcel are compared across the same season.
The TerraScane NDVI classification divides -1 to +1 into seven classes. The range -1 to 0 is the "Water Bodies" class; all seven classes appear with their areas in the example below.
Which satellite data gives NDVI?
NDVI can be calculated from any optical satellite that has a red and a near-infrared band. These are the satellites and date ranges you can select in TerraScane:
| Satellite | Resolution | Date range |
|---|---|---|
| Sentinel-2 | 10 m | March 28, 2017 to present |
| Landsat 8 and 9 | 30 m | April 11, 2013 to present |
| Landsat 5 | 30 m | March 16, 1984 to May 5, 2012 |
| MODIS | 1,000 m | February 18, 2000 to present |
The date ranges and data notes for all satellites, including Landsat 7, are on the satellite data page. With two satellites, the Sentinel-2 mission has a nominal revisit time of 5 days at the Equator (SentiWiki). The number of images used in an analysis is written in the report.
TerraScane example: NDVI in Balıkesir-Merkez
One period: July 2026
The map below is a single-period NDVI analysis run in TerraScane for Balıkesir-Merkez: 14,623 ha, the period July 1-31, 2026, Sentinel-2 (10 m) data, 17 images. Each color on the map is an NDVI class.
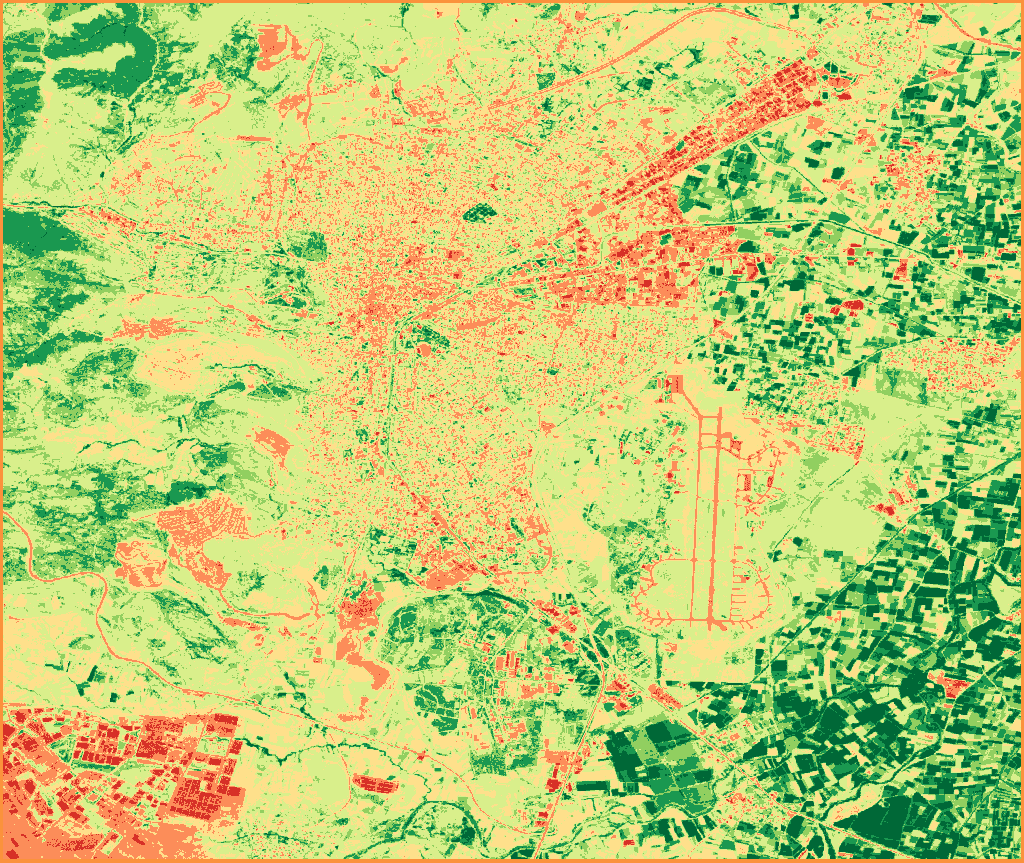
NDVI, single period · Sentinel-2 (10 m) · July 1-31, 2026 · Balıkesir-Merkez · 17 images
Contains modified Copernicus Sentinel data 2026
The Excel output of the same analysis gives the area and share of each of the seven classes. The class ranges and the colors on the map are in the table:
| Class | NDVI range | Color on the map | Area (ha) | Share (%) |
|---|---|---|---|---|
| Water Bodies | -1 to 0 | red | 198.26 | 1.36 |
| Bare Soil | 0 to 0.1 | orange | 1,517.03 | 10.37 |
| Sparse Vegetation | 0.1 to 0.2 | light yellow | 4,000.99 | 27.36 |
| Low Density | 0.2 to 0.4 | yellowish green | 4,685.27 | 32.04 |
| Medium Density | 0.4 to 0.6 | light green | 2,144.42 | 14.66 |
| Dense Vegetation | 0.6 to 0.8 | green | 1,401.32 | 9.58 |
| Very Dense Vegetation | 0.8 to 1 | dark green | 675.73 | 4.62 |
The mean NDVI of the area is 0.3240, the minimum is -0.2432, the maximum is 0.9658, and the standard deviation is 0.2202. The Low Density and Sparse Vegetation classes together cover 59.4% of the area. The image below is the Excel output these numbers come from.
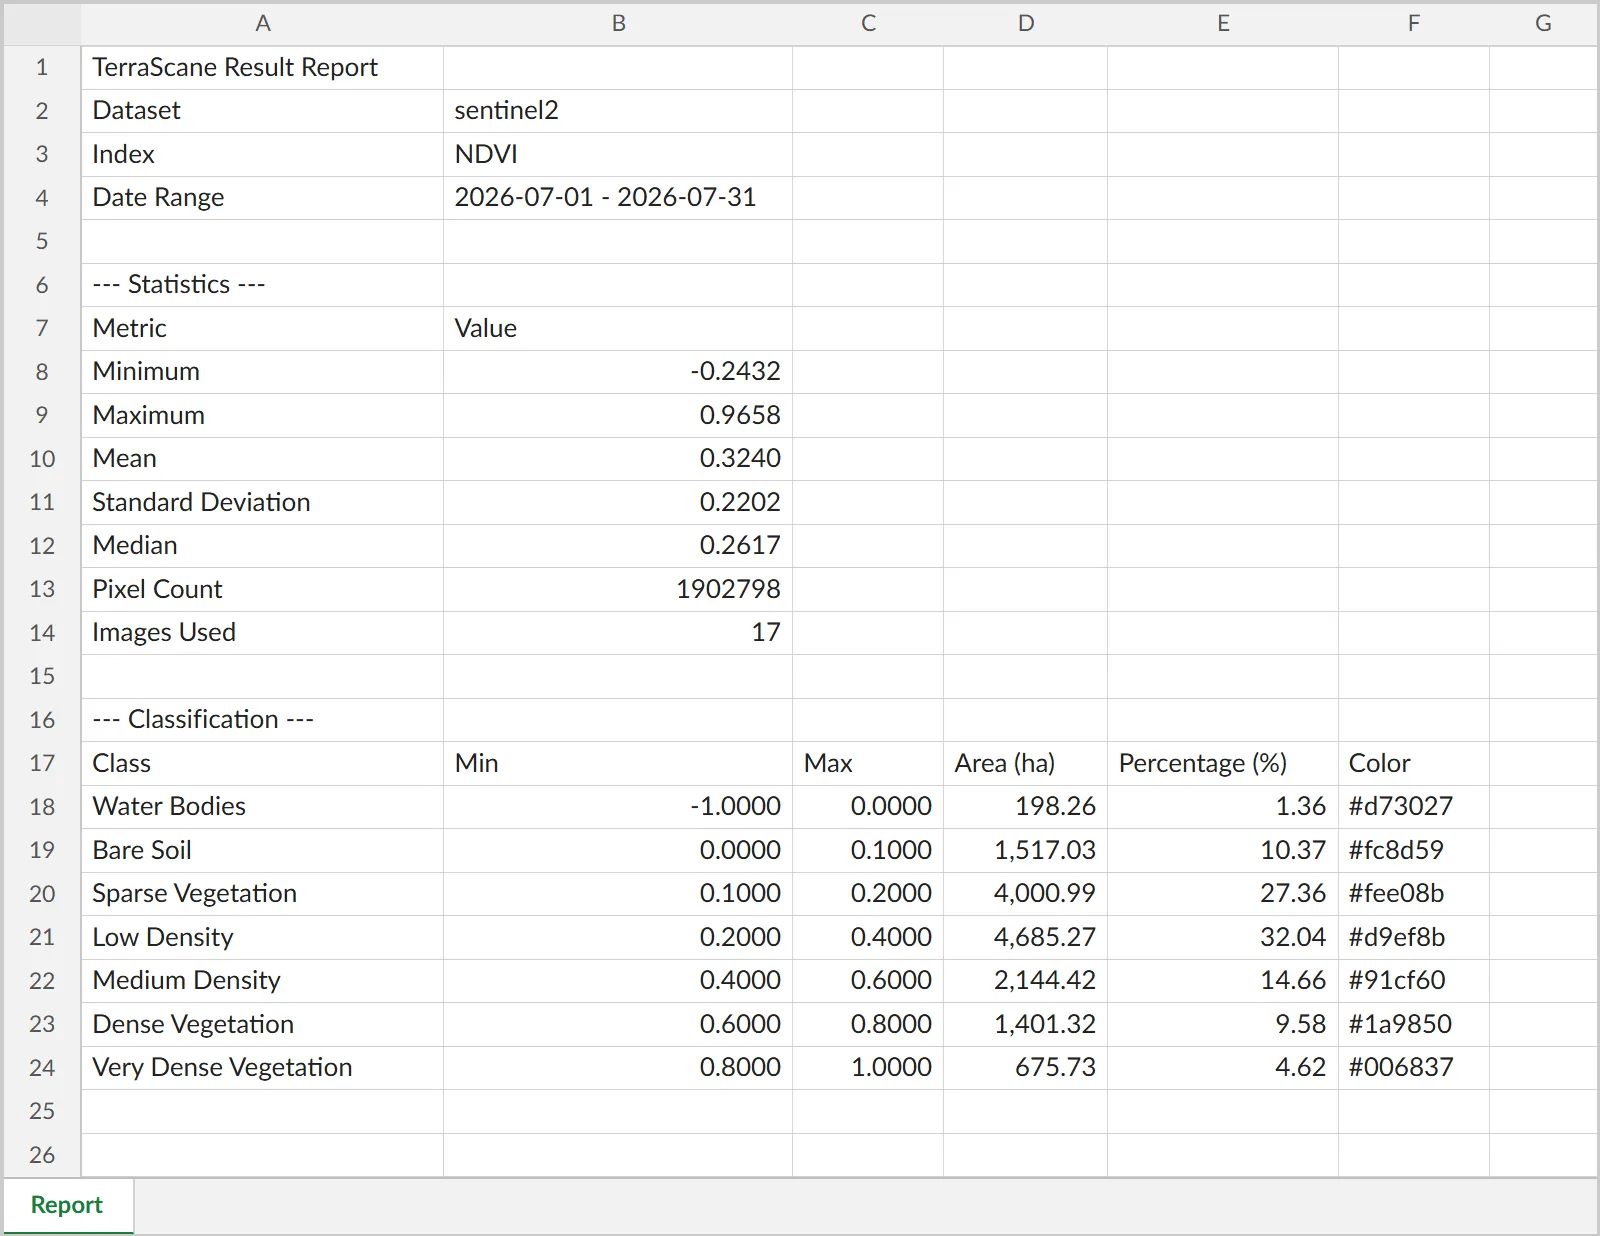
Excerpt from the Excel output · NDVI, single period · Sentinel-2 (10 m) · July 1-31, 2026 · Balıkesir-Merkez · 17 images
Contains modified Copernicus Sentinel data 2026
The same analysis is downloaded as a PDF report, an Excel table, and a KMZ file; all formats are shown on the outputs page.
Two periods: June 2020 and June 2026
Comparing the NDVI of two periods shows change over time. NDVI maps were produced for the same area for June 2020 (11 images) and June 2026 (16 images), both from Sentinel-2 (10 m). The delta map subtracts the NDVI of the first period from the NDVI of the second and sorts the difference into five classes.
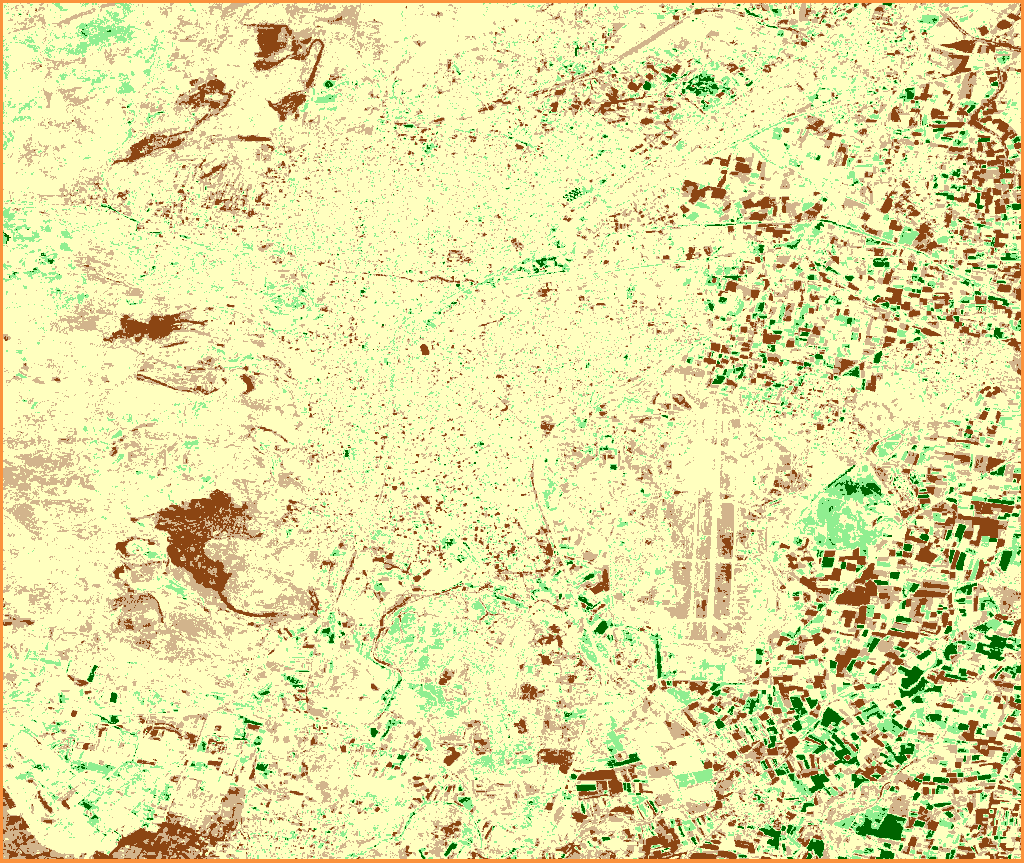
NDVI change, June 2020 to June 2026 · Sentinel-2 (10 m) · Balıkesir-Merkez
Contains modified Copernicus Sentinel data 2020, 2026
| Class | NDVI difference | Color on the map | Area (ha) | Share (%) |
|---|---|---|---|---|
| Severe Degradation | -2 to -0.25 | brown | 992.06 | 6.8 |
| Slight Decline | -0.25 to -0.1 | beige | 2,356.84 | 16.1 |
| No Change | -0.1 to 0.1 | light yellow | 9,823.77 | 67.2 |
| Slight Improvement | 0.1 to 0.25 | light green | 1,147.18 | 7.8 |
| Strong Improvement | 0.25 to 2 | dark green | 297.78 | 2 |
Of the area, 9,823.77 ha (67.2%) lies between -0.1 and 0.1, in the No Change class. 992.06 ha (6.8%) falls in Severe Degradation and 297.78 ha (2%) in Strong Improvement. Both periods were taken from the same satellite data and the same month. The kinds of analysis available on the platform are listed on the analysis types page.
Which vegetation index should you use, and when?
In very dense cover, in sparse cover, or when moisture and chlorophyll matter, other indices are used alongside NDVI or in its place:
| Index | When to use it |
|---|---|
| NDVI | To track how dense the green vegetation is and how it changes from period to period |
| EVI | In dense cover such as forest, where NDVI saturates, to see differences |
| SAVI | On parcels where plants are sparse and the soil shows through, especially early in the growing season |
| NDRE | To spot chlorophyll and nitrogen deficiency early; the red edge band is only on Sentinel-2, at 20 m resolution |
| NDMI | To track vegetation moisture and drought stress; logging and degradation in forests also lower the value |
The main references are Huete and colleagues (2002) for EVI, Huete (1988) for SAVI, and Wilson and Sader (2002) for NDMI. NDRE comes from the work of Barnes and colleagues (2000) and is listed with its citation on the indices page; Clevers and Gitelson (2013) study chlorophyll and nitrogen estimation in crops and grass with red-edge bands. The links are below. When periods are compared, the same index and the same satellite data are used.
When is NDVI reliable, and what are its limits?
- In dense cover NDVI saturates. Huete and colleagues found this in high-biomass regions such as the Amazon, where EVI stayed sensitive to canopy variation (DOI). NASA Earth Observatory also notes that EVI does not saturate as easily as NDVI over rainforests.
- Where the soil shows through sparse cover, the ground beneath affects NDVI; SAVI was developed to reduce this effect (Huete, 1988).
- EVI is designed to correct distortions caused by particles in the air and by the ground beneath the vegetation (NASA Earth Observatory).
- A Sentinel-2 pixel is 10 m × 10 m (100 m²), a Landsat pixel 30 m × 30 m (900 m²), and a MODIS pixel 1,000 m. The value of a pixel reflects the mix of all surfaces inside that square.
- The same crop falls in different ranges depending on its stage (USGS: senescing crops 0.2 to 0.5, crops at peak growth 0.6 to 0.9). The two-period comparison in TerraScane uses the same satellite data for both periods; both periods in the example are June.
- Cloud usually lowers NDVI values. The light a satellite detects can be altered or blocked by aerosols and clouds in the atmosphere, and they add noise to the raw data (USGS). Snow also gives very low values, 0.1 or lower (USGS). Sentinel-2 passes overhead at 10:30 local solar time, a time chosen to balance minimal cloud cover against enough solar illumination (SentiWiki).
- The number of images used in an analysis changes from period to period: in the example, 17 for July 2026, 11 for June 2020, and 16 for June 2026. The report states this number.
How can NDVI be tracked across many parcels?
The NDVI of a single parcel comes from one analysis. When NDVI is needed for many parcels over the same periods, the batch parcel analysis service produces a separate report for each parcel. For change and loss between two periods, the change and loss detection service is available. To run the same analysis on your own parcel, you can try the platform for free.
Sources
- Rouse, J. W., Haas, R. H., Schell, J. A., Deering, D. W. (1974). Monitoring vegetation systems in the Great Plains with ERTS. 3rd ERTS-1 Symposium. NASA NTRS 19740022614
- Carlson, T. N., Ripley, D. A. (1997). On the relation between NDVI, fractional vegetation cover, and leaf area index. Remote Sensing of Environment 62(3), 241-252. DOI 10.1016/S0034-4257(97)00104-1
- Huete, A., Didan, K., Miura, T., Rodriguez, E. P., Gao, X., Ferreira, L. G. (2002). Overview of the radiometric and biophysical performance of the MODIS vegetation indices. Remote Sensing of Environment 83(1-2), 195-213. DOI 10.1016/S0034-4257(02)00096-2
- Huete, A. R. (1988). A soil-adjusted vegetation index (SAVI). Remote Sensing of Environment 25(3), 295-309. DOI 10.1016/0034-4257(88)90106-X
- Clevers, J. G. P. W., Gitelson, A. A. (2013). Remote estimation of crop and grass chlorophyll and nitrogen content using red-edge bands on Sentinel-2 and -3. International Journal of Applied Earth Observation and Geoinformation 23, 344-351. DOI 10.1016/j.jag.2012.10.008
- Wilson, E. H., Sader, S. A. (2002). Detection of forest harvest type using multiple dates of Landsat TM imagery. Remote Sensing of Environment 80(3), 385-396. DOI 10.1016/S0034-4257(01)00318-2
- USGS. NDVI, the Foundation for Remote Sensing Phenology (2018)
- USGS. Data Smoothing: Reducing the Noise in NDVI (2018)
- NASA Earth Observatory. Measuring Vegetation (NDVI and EVI)
- USGS. What are the band designations for the Landsat satellites?
- Copernicus. Sentinel-2 mission (SentiWiki)
Related guides and pages
Get a quote for your parcels, or try the platform yourself for free.