
How to detect surface water and wetlands from satellite imagery
Author: Cumhur Eren BilalPublished: Last updated:
Open surface water is detected in satellite imagery with water indices such as NDWI and MNDWI, which compare the green band with a near-infrared or shortwave-infrared band. A wetland covers open water and also vegetated areas such as marshes and reed beds, so a water index can be read together with a vegetation index and with images from different seasons.
The numbers in this guide come from a real land cover analysis and wetland screening around Lake Manyas (Balıkesir), run on TerraScane, a satellite analysis platform, and each one is given with its year, resolution, and area. The definition, the indices, and the satellite data come first.
| Topic | In brief |
|---|---|
| Open water indices | NDWI (McFeeters, 1996) and MNDWI (Xu, 2006) |
| NDWI formula | NDWI = (GREEN - NIR) / (GREEN + NIR) |
| MNDWI formula | MNDWI = (GREEN - SWIR1) / (GREEN + SWIR1) |
| Sentinel-2 bands | B3 and B8 (10 m) for NDWI, B3 (10 m) and B11 (20 m) for MNDWI |
| Landsat 8 and 9 bands | Bands 3 and 5 for NDWI, bands 3 and 6 for MNDWI (30 m) |
| Example analysis | Lake Manyas area, 46,974 ha: the Water class is 32.2% in 2016 and 31.9% in 2026 (partial year) |
What is a wetland, and how does it differ from surface water?
Türkiye's General Directorate of Nature Conservation and National Parks, part of the Ministry of Agriculture and Forestry, defines wetlands as all waters, marshes, reed beds, and peatlands that matter as habitat for living things, especially waterbirds, together with the areas on the land side of the shoreline of these places that remain wetland from an ecological point of view. The waters may be natural or artificial, permanent or temporary, standing or flowing, fresh, brackish, or salt, and include marine areas whose depth at low tide does not exceed six meters (Ministry of Agriculture and Forestry, in Turkish).
Open surface water such as a lake, pond, or river is part of a wetland; a wetland also includes vegetated areas such as marshes and reed beds. The definition covers temporary water too. Kaplan and Avdan (2017) describe a wetland as a land area saturated with water, permanently or seasonally, and write that satellite data makes it possible to monitor wetland change seasonally and over longer periods (DOI).
Which index finds surface water?
NDWI, the Normalized Difference Water Index, is the index McFeeters (1996) proposed for delineating open water features (DOI). It divides the difference between green and near-infrared (NIR) reflectance by their sum:
NDWI = (GREEN - NIR) / (GREEN + NIR)
Water absorbs near-infrared light, so this band helps separate land from water where the boundary is not obvious in visible light (NASA Earth Observatory).
MNDWI, the Modified Normalized Difference Water Index, is Xu's (2006) proposal to replace the near-infrared band in NDWI with a middle-infrared band; in that study the band is Landsat TM band 5. In today's naming the shortwave-infrared band (SWIR1) is used:
MNDWI = (GREEN - SWIR1) / (GREEN + SWIR1)
According to Xu, the water information extracted with NDWI is often mixed with built-up land noise, so the extracted water area is overestimated; MNDWI is more suitable for separating water information where built-up land dominates the background (DOI).
A second index also goes by the name NDWI: Gao (1996) proposed a separate index for remote sensing of vegetation liquid water from space (DOI). In this guide NDWI means McFeeters' open water index; for the moisture held in plants the platform has NDMI.
NDWI values are read this way in Landsat images: values above zero are water pixels. The zero threshold can miss small water bodies and waters that contain vegetation (DOI). The threshold can change with the sensor and the area: in Kaplan and Avdan's Sentinel-2 study, the NDWI threshold used for water differed from the zero known for Landsat.
Which satellite data does it come from?
NDWI and MNDWI can be calculated from any optical satellite that has a green band and a near-infrared or shortwave-infrared band. The satellites selectable in TerraScane and their date ranges are:
| Satellite | Resolution | Bands (green, NIR, SWIR1) | Date range |
|---|---|---|---|
| Sentinel-2 | 10 m (green and NIR), 20 m (SWIR1) | B3, B8, B11 | March 28, 2017 to present |
| Landsat 8 and 9 | 30 m | Bands 3, 5, and 6 | April 11, 2013 to present |
| Landsat 5 | 30 m | Bands 2, 4, and 5 | March 16, 1984 to May 5, 2012 |
The date ranges and data notes for all satellites, including Landsat 7, are on the satellite and data page. On Landsat 7 the bands carry the same numbers as on Landsat 5 (USGS). The resolutions of the Sentinel-2 bands and the mission's nominal revisit time (5 days at the Equator with two satellites) are given in SentiWiki.
How are wetlands detected with satellite data?
A water index alone may not be enough for wetland mapping, because a wetland includes vegetated areas. Kaplan and Avdan (2017) compared pixel-based, object-based, and index-based classification on a Sentinel-2 image of July 31, 2016, over a wetland in Türkiye. Their proposed method extracts the wetland boundary with object-based classification and then separates the vegetated, mixed, and water areas inside the boundary with NDVI and NDWI (DOI).
In the same study NDVI showed the vegetation density inside the wetland and NDWI separated the water areas from other surfaces, but none of these methods could extract the wetland boundary and contents on its own. Türkiye's inventory document submitted to the UN also states that different indices, such as NDWI, are used to delineate wetlands (UNFCCC).
TerraScane example: surface water and wetland around Lake Manyas
The two maps below are the 2016 and 2026 maps that a TerraScane land cover analysis produced for the Lake Manyas area (Balıkesir): 46,974 ha, 10 m resolution. Each color on the map is a land cover class; the Water class is blue and the Flooded vegetation class is purple along the shore. 2026 is a partial year.
Land cover in 2016 and 2026
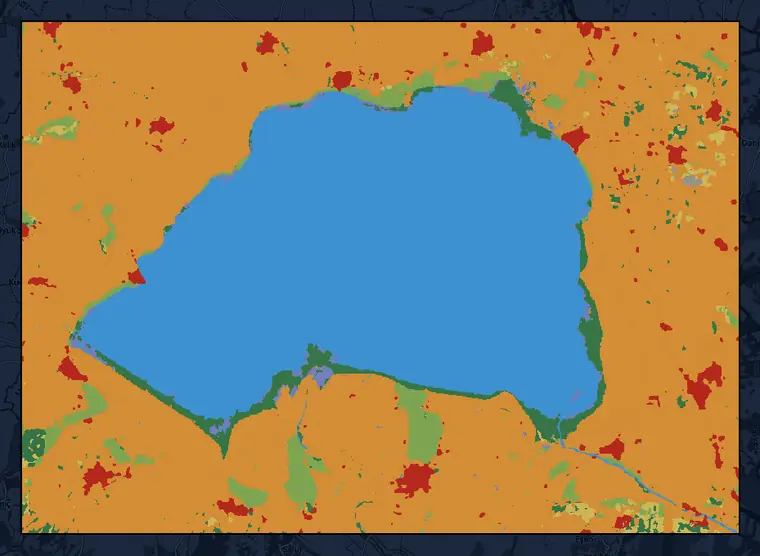
Dynamic World land cover, 10 m · Lake Manyas area, Balıkesir (46,974 ha) · percentages for 2016 and 2026
This dataset is produced for the Dynamic World Project by Google in partnership with National Geographic Society and the World Resources Institute. Contains modified Copernicus Sentinel data 2016, 2026 · CC BY 4.0 · © OpenStreetMap contributors
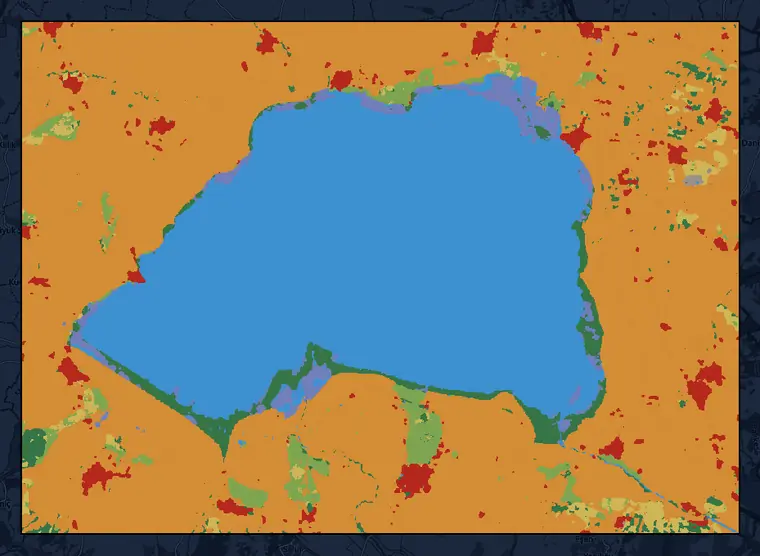
Wetland screening and Dynamic World land cover, 2026 (partial year) · 10 m · Lake Manyas area, Balıkesir (46,974 ha)
This dataset is produced for the Dynamic World Project by Google in partnership with National Geographic Society and the World Resources Institute. Contains modified Copernicus Sentinel data 2016, 2026 · CC BY 4.0 · © OpenStreetMap contributors
The class shares are in the table below; 2026 is a partial year:
| Class | Color on the map | 2016 (%) | 2026, partial year (%) |
|---|---|---|---|
| Water | blue | 32.2 | 31.9 |
| Flooded vegetation | purple | 0.7 | 2.0 |
| Crops | orange | 57.2 | 55.6 |
| Trees | dark green | 3.2 | 3.4 |
| Built area | red | 2.5 | 2.9 |
| Grass | light green | 3.3 | 2.5 |
| Shrub & scrub | yellow | 0.9 | 1.7 |
| Bare ground | gray | 0.1 | 0.1 |
The Water class covers 32.2% of the area in 2016 and 31.9% in 2026 (partial year).
The share of the Flooded vegetation class is 0.7% in 2016 and 2.0% in 2026 (partial year).
Output of the wetland screening
The wetland screening run for the same area gives one indicator per parcel, its reasoning, and the distance to the nearest open water. The 2026 screening of the Manyas example (partial year) is:
| Output | Lake Manyas area, 2026 (partial year) |
|---|---|
| Wetland indicator | High |
| Nearest open water | 0 km |
This is a screening result: when the indicator is high or medium, the file recommends field verification. The info balloon in the file states which observations contributed to the result and which period they come from. The contents of the file and the two values in the table are shown in the example on the wetland screening service page.
Which index should you use, and when?
In areas where built-up land dominates, or when vegetation moisture or the density of vegetation inside a wetland is being tracked, other indices are used alongside or instead of NDWI:
| Index | When to use it |
|---|---|
| NDWI | Find open water surfaces such as lakes, flood areas, and irrigated rice paddies, and track water spreading and receding |
| MNDWI | Use it instead of NDWI in built-up areas where open water must be separated from buildings; snow and ice can also give values similar to water |
| NDMI | Track vegetation moisture and drought stress |
| NDVI | Track how dense the vegetation inside a wetland is and how it changes from period to period |
The values and interpretation of NDVI are covered in the NDVI guide. When comparing periods, the same index and the same satellite data are used.
How can a parcel be checked for surface water and wetland?
A parcel can be checked for surface water and wetland by reading its water index and its land cover map side by side:
- The parcel boundary is drawn on the platform or uploaded as a KML, KMZ, SHP, or GeoJSON file.
- An NDWI or MNDWI analysis is run. Because a wetland can be saturated with water permanently or seasonally, the analysis can be repeated for different times of the year.
- On the land cover map, the shares of the Water and Flooded vegetation classes are read; in the wetland screening, the indicator and its reasoning are read.
When is surface water and wetland detection reliable, and what are its limits?
- Built-up land can look like water. Water information extracted with NDWI is often mixed with built-up land noise, which is why Xu (2006) proposes MNDWI.
- Small water bodies and waters that contain vegetation can fall outside the threshold. In Kaplan and Avdan's study the zero threshold could not extract them, and the threshold changed for Sentinel-2.
- Snow and ice can also give values similar to water (MNDWI description).
- Cloud and cloud shadow can distort the result. The light a satellite detects can be altered or blocked by clouds (USGS); in Kaplan and Avdan's study the only source of misclassification was cloud shadow.
- A wetland can be saturated with water permanently or seasonally. This is why a report states which period every number belongs to.
- On Sentinel-2 the green and near-infrared bands are 10 m and SWIR1 is 20 m; on Landsat the resolution is 30 m (SentiWiki, USGS). The value of a pixel reflects the mix of all surfaces inside that square.
How are wetlands tracked in reporting?
Surface water and wetland maps are used in reporting to show the area of wetlands and how it changes over time. Carbon stock is calculated separately; these maps are an input to the area and conversion data used in that calculation.
| Use | What it adds to the report |
|---|---|
| Pre-screening parcels for wetlands | For each parcel the file states one indicator, its reasoning, and the distance to the nearest open water, together with the period of the observations it rests on; when the indicator is high or medium, the file recommends field verification (wetland screening service). |
| Separating wetlands in the national inventory | Türkiye's inventory submitted to the UN mapped land use for 1990-2015 from satellite imagery and used indices such as NDWI to separate wetlands (UNFCCC). |
| Tracking land use and conversions by location | The IPCC inventory guidelines describe spatially explicit observation of land-use categories and conversions (Approach 3); these observations can use gridded maps derived from remote sensing imagery (IPCC). |
| Change in the extent of water-related ecosystems | The UN's SDG indicator 6.6.1 tracks the change in the extent of water-related ecosystems and uses satellite-based Earth observations for it; satellite data series exist for the area of permanent and seasonal water, reservoirs, and wetlands (UN). |
This information helps document, with dates and areas, how surface water and wetland changed over the periods.
TerraScane is a measurement and monitoring tool: in the land cover map it gives the share of the Water and Flooded vegetation classes and shows the difference between two years side by side; for each parcel it writes the wetland indicator with its reasoning. A report states which year every number comes from. In the Lake Manyas example above, the Water class covers 31.9% of the area in 2026 (partial year). For land cover maps there is the land cover service.
How can many parcels be screened for surface water and wetland?
The water index of a single parcel comes from one analysis. When many parcels need to be checked for overlap with a wetland before a project starts, the wetland screening service delivers one indicator and its reasoning for each parcel in a KMZ file; the land cover map of the parcel is in the same file. To run an NDWI or MNDWI analysis on your own parcel, you can try the platform for free.
Sources
- McFeeters, S. K. (1996). The use of the Normalized Difference Water Index (NDWI) in the delineation of open water features. International Journal of Remote Sensing 17(7), 1425-1432. DOI 10.1080/01431169608948714
- Xu, H. (2006). Modification of normalised difference water index (NDWI) to enhance open water features in remotely sensed imagery. International Journal of Remote Sensing 27(14), 3025-3033. DOI 10.1080/01431160600589179
- Gao, B.-C. (1996). NDWI: a normalized difference water index for remote sensing of vegetation liquid water from space. Remote Sensing of Environment 58(3), 257-266. DOI 10.1016/S0034-4257(96)00067-3
- Kaplan, G., Avdan, U. (2017). Mapping and monitoring wetlands using Sentinel-2 satellite imagery. ISPRS Annals of the Photogrammetry, Remote Sensing and Spatial Information Sciences IV-4/W4, 271-277. DOI 10.5194/isprs-annals-IV-4-W4-271-2017
- Ministry of Agriculture and Forestry of Türkiye, General Directorate of Nature Conservation and National Parks. Basic Concepts (Temel Kavramlar), in Turkish
- NASA Earth Observatory. Why is that Forest Red and that Cloud Blue? How to Interpret a False-Color Satellite Image
- USGS. What are the band designations for the Landsat satellites?
- USGS. Data Smoothing: Reducing the Noise in NDVI (2018)
- Copernicus. Sentinel-2 mission (SentiWiki)
- IPCC (2006). 2006 IPCC Guidelines for National Greenhouse Gas Inventories, Volume 4, Chapter 3: Consistent Representation of Lands. IPCC NGGIP
- Türkiye (2024). Turkish Greenhouse Gas Inventory 1990-2022: National Inventory Document. UNFCCC. UNFCCC
- United Nations Statistics Division (2025). SDG indicator metadata, Indicator 6.6.1: Change in the extent of water-related ecosystems over time (custodian agency: UNEP; last updated June 11, 2025). UN Statistics Division
Related guides and pages
Get a quote for your parcels, or try the platform yourself for free.